Enable and use the Query Store
The Query Store is a SQL Server feature, available since the 2016 version, that keeps and aggregates query performance information.
Enable the Query Store on all your databases, with the AUTO capture mode. It is an essential tool for diagnosing performance problems. On a parameterized workload its cost cannot be measured; on an ad hoc workload it depends on the capture mode, which you can tune. Leaving it off means giving up the information you need to understand and fix execution plan regressions.
Enable the Query Store
You can enable the Query Store, or check that it is already enabled, from the database properties.
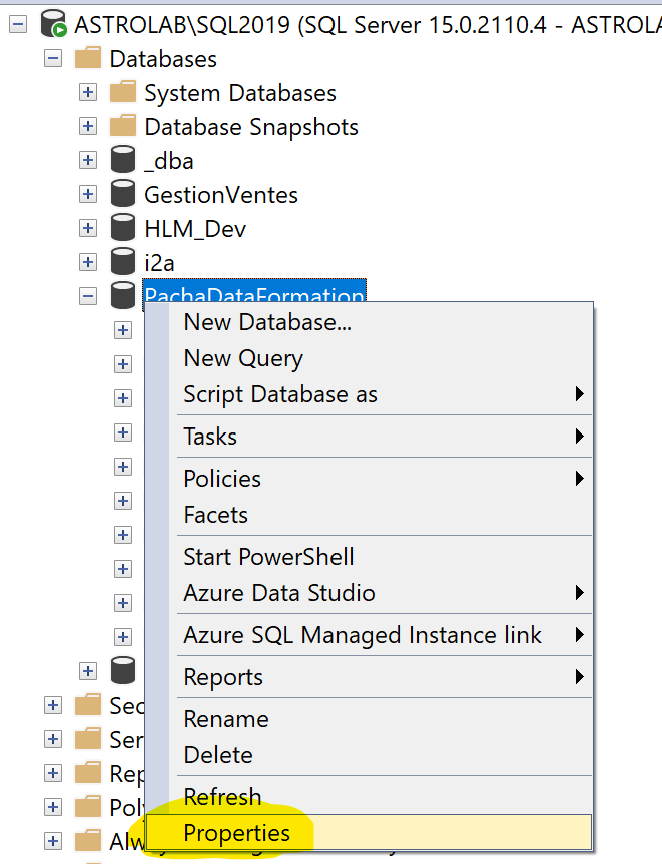
To open the database properties window, right-click the database in SQL Server Management Studio (SSMS) and choose Properties, as shown below.
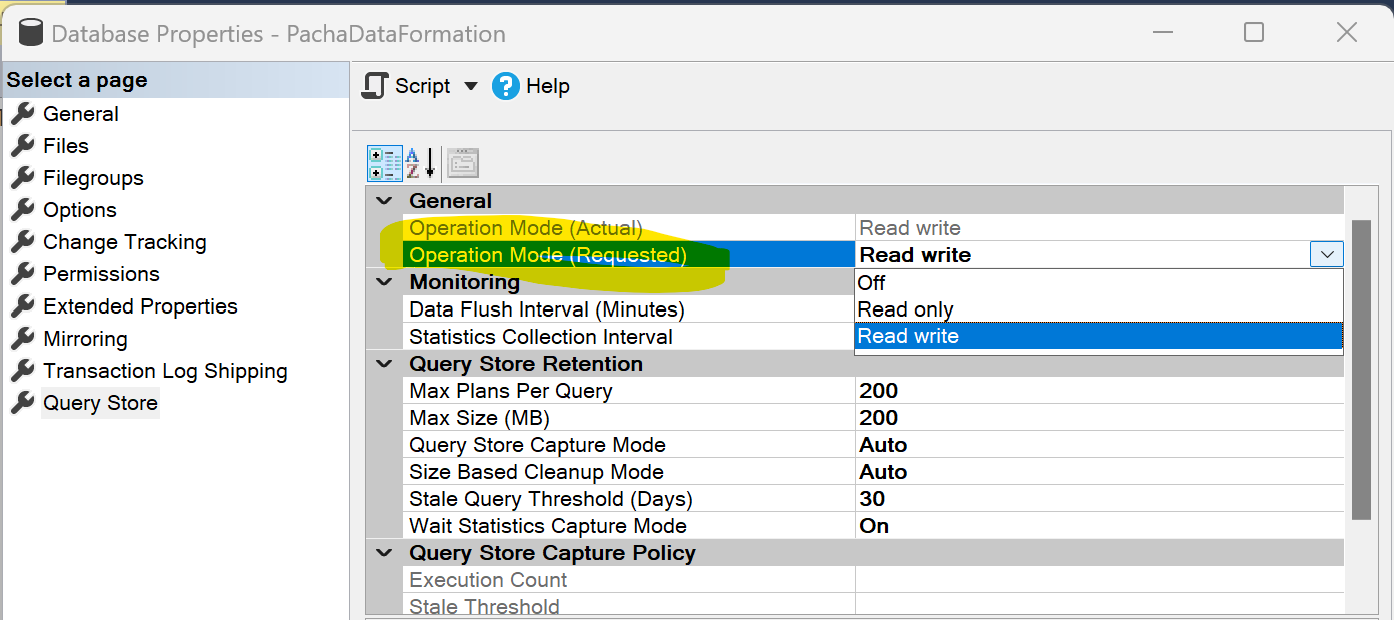
In the window that opens, click Query Store in the left-hand menu.
The Query Store must be enabled (Read-Write), and the capture mode must be Auto, as shown below.
Enable the Query Store with a script
This query shows which databases have the Query Store enabled on your instance:
-----------------------------------------------------------------
-- check is the query store is enabled on some databases.
--
-- rudi@babaluga.com, go ahead license
-----------------------------------------------------------------

SET NOCOUNT ON;
SET TRANSACTION ISOLATION LEVEL READ UNCOMMITTED;

SELECT
	d.name,
	d.database_id,
	d.create_date,
	d.state_desc as [state]
FROM sys.databases d
WHERE d.is_query_store_on = 1
OPTION (RECOMPILE, MAXDOP 1);
In the Query Store properties, also check the following settings:
actual_state— must beREAD_WRITE;query_capture_mode— must beAUTO;max_storage_size_mb— should be at least 1000, so that the Query Store has enough dedicated space to hold a history long enough to be useful for diagnosis.
To enable the Query Store on a database with T-SQL, use the following query:
-----------------------------------------------------------------------------------
-- Activate the Query Store on a database and apply recommended settings
-- (change db_name)

-- To specify the database name, use the "Specify Values for Template Parameters"
-- Navigate to Query-> Specify Values for Template Parameters.
-- Or use keyboard shortcut key Ctrl+Shift+M.
--
-- rudi@babaluga.com, go ahead license
-----------------------------------------------------------------------------------

SET NOCOUNT ON;
SET TRANSACTION ISOLATION LEVEL READ UNCOMMITTED;

ALTER DATABASE [<db_name, sysname, >] SET QUERY_STORE = ON
(
	OPERATION_MODE = READ_WRITE,

	-- Data retention period (30 days by default, 60 for more history)
    CLEANUP_POLICY = (STALE_QUERY_THRESHOLD_DAYS = 30),

    -- Flush to disk (900 sec = 15 min by default)
    DATA_FLUSH_INTERVAL_SECONDS = 900,

   -- Maximum storage size for Query Store
   -- Default 2019+ = 1000 MB, but 2000-5000 MB recommended in production
 	MAX_STORAGE_SIZE_MB = 2000,

    -- Stats aggregation interval (60 min by default, 30 for more granularity)
    INTERVAL_LENGTH_MINUTES = 60,

   -- Automatic cleanup when close to the limit
    SIZE_BASED_CLEANUP_MODE = AUTO,

    -- Capture mode: AUTO filters trivial queries
    -- ALL = capture everything (debug), NONE = pause, CUSTOM = fine rules (2019+)
	QUERY_CAPTURE_MODE = AUTO
)
GO
Does the Query Store affect performance?
A common worry is that enabling the Query Store degrades server performance. The answer depends on the workload and on the capture mode, and Microsoft publishes no percentage: the 3 to 5 % figure that circulates does not come from its documentation.
Microsoft enables it by default
Since SQL Server 2022, the Query Store is enabled by default on all new databases. A database restored or migrated from an earlier version keeps its own settings, though: after a migration, check that it is actually on. It is also enabled by default on Azure SQL Database and Azure SQL Managed Instance.
Several optimizer features depend on it: Query Store hints, CE feedback and DOP feedback.
Collection in memory, written later
Execution statistics are collected in memory, then written to disk asynchronously, every 15 minutes by default (DATA_FLUSH_INTERVAL_SECONDS = 900). Capturing a new query is asynchronous too: it shows up in the Query Store a few seconds after it runs.
The cost of collection by workload
Measured on SQL Server 2025:
- on a parameterized workload (stored procedures, prepared statements), the cost of the Query Store could not be measured in
ALL,AUTOorCUSTOMcapture mode; - on an ad hoc workload, where every query has a different text,
ALLslowed queries down by 19 % on one connection and by 41 % on eight;AUTOandCUSTOM, which do not capture these single-execution queries, stayed within a few percent; - the
NONEmode, which stops capturing new queries, does not make the Query Store lighter: it takes an exclusive lock on every execution of a statement it has not captured, and made a parameterized query run by eight connections 3.6 times slower.
AUTO has been the default capture mode since SQL Server 2019 (ALL in 2016 and 2017). CUSTOM, available since SQL Server 2019, lets you tune the capture thresholds if AUTO still lets too many queries through.
When the Query Store switches to read-only
If the Query Store reaches its storage limit (MAX_STORAGE_SIZE_MB), it switches automatically to READ_ONLY. It also switches temporarily when the memory holding data waiting to be written reaches its internal limit (readonly_reason = 262144), which happens under a sustained ad hoc workload in ALL mode. In both cases queries keep running normally, but the Query Store records nothing: your diagnostic data has a gap. Size-based cleanup (SIZE_BASED_CLEANUP_MODE = AUTO) prevents the first case; the AUTO capture mode prevented the second in our tests.
Good practice for minimal impact
- Use the
AUTOorCUSTOMcapture mode (neverALLin production). - Do not use
NONEto lighten the Query Store: to pause collection, switch toREAD_ONLYor turn it off. - Set
MAX_STORAGE_SIZE_MBto 1000 MB at least. - Keep
SIZE_BASED_CLEANUP_MODE = AUTOfor automatic cleanup. - On SQL Server 2016, 2017 and 2019, install the latest cumulative updates: the memory limits that protect the instance from an ad hoc workload arrived there through CUs.
Leaving the Query Store off means giving up information that is essential to diagnosing performance problems. With the AUTO capture mode its cost is negligible on a parameterized workload and small on an ad hoc one, and it remains your best ally for understanding and fixing execution plan regressions. Enable it on all your databases.
If you do not have the Query Store (SQL Server 2014 and earlier)
You can instead capture the most expensive and most resource-hungry queries with an Extended Events session:
-------------------------------------------------------------------------------------------------------------------
-- create a session to trace long running queries based on
-- elapsed execution time.
--
-- rudi@babaluga.com, go ahead license

/*
- To set the min execution time for a query to appear in the session, change these two lines below:
	[package0].[greater_than_uint64]([duration],(1000000))

  Set the value in microseconds. Current value is 1000000, which is 1 second, or 1000 milliseconds.

- Change STARTUP_STATE=ON to STARTUP_STATE=OFF if you don't want the session to be restarded when SQL Server restarts

- The sessions will write trace files in the log directory, you can find where it is in your system by
  using the following query:
	SELECT SERVERPROPERTY('ErrorLogFileName')

  The files will be named long_running_queries*.xel
  There will be a maximum of 5 files, sizing 200 Mb max each. If you want less space, or need more space,
  change the number of Mb in the following line :
	max_file_size=(200)
*/
-------------------------------------------------------------------------------------------------------------------


CREATE EVENT SESSION [long_running_queries]
ON SERVER
ADD EVENT sqlserver.rpc_completed(
    ACTION(
		sqlserver.client_app_name,
		sqlserver.client_hostname,
		sqlserver.database_name,
		sqlserver.username)
    WHERE (
		[package0].[greater_than_uint64]([duration],(1000000)) -- = 1000 milliseconds, or 1 second.
		AND [sqlserver].[not_equal_i_sql_unicode_string]([sqlserver].[client_app_name],N'telegraf'))), -- example of session to exclude

ADD EVENT sqlserver.sql_batch_completed(
    ACTION(
		sqlserver.client_app_name,
		sqlserver.client_hostname,
		sqlserver.database_name,
		sqlserver.username)
    WHERE (
		[package0].[greater_than_uint64]([duration],(1000000)) -- = 1000 milliseconds, or 1 second.
		AND [sqlserver].[not_equal_i_sql_unicode_string]([sqlserver].[client_app_name],N'telegraf')))  -- example of session to exclude
ADD TARGET package0.event_file(
	SET filename=N'long_running_queries',
		max_file_size=(200) -- in megabytes
	)
WITH (
        MAX_MEMORY=4096 KB,
        EVENT_RETENTION_MODE=ALLOW_SINGLE_EVENT_LOSS,
        MAX_DISPATCH_LATENCY=30 SECONDS,
        MAX_EVENT_SIZE=0 KB,
        MEMORY_PARTITION_MODE=NONE,
        TRACK_CAUSALITY=OFF,
        STARTUP_STATE=ON -- restart the session when SQL Server restarts
)
GO

-- start the session
ALTER EVENT SESSION [long_running_queries] ON SERVER STATE=START;
-- stop the session
/*
ALTER EVENT SESSION [long_running_queries] ON SERVER STATE=STOP;
*/
Going further
- DataFrogs session videos about the Query Store (in French).