Identify blocking problems
Categories:
Blocking happens when one session waits for a lock held by another session. To find out who blocks what, you enable the blocked process threshold and start an Extended Events session that records a report every time a block exceeds that threshold. You let it run for a few days, compress the .xel files and send them for analysis. The impact on production is negligible.
This page is a procedure to follow from start to finish. If you are in a hurry, the five steps are: set the threshold, create the session, let it run, collect the files, clean up.
What this collection is for
Blocking comes from locks held on the same resources by different sessions. A session waiting for a lock consumes no CPU: it waits, and the user in front of the screen waits with it. From the application’s point of view this looks like “SQL Server is slow”, when in fact the server is doing nothing at all.
Diagnosing it after the fact is hard, because a block leaves no trace: by the time you look, it is already over. This is why the server has to be instrumented before the problem happens again.
The blocked process report answers exactly the questions that matter:
- which session was waiting, and for how long;
- which session was blocking it, what query it was running, and from which machine;
- on which object, which index, and with which lock mode;
- whether the blocking session was actually working, or simply sleeping with an open transaction — by far the most common case.
Before you start: is blocking really the problem?
There is no point instrumenting if the problem lies elsewhere. Two quick checks.
Wait statistics
The waits accumulated since the instance started tell you whether locking is a real burden. Run the wait analysis query:
---------------------------------------------------------------------------------------------------------
-- copied from https://www.sqlskills.com/blogs/paul/wait-statistics-or-please-tell-me-where-it-hurts/
-- please refer to the original query!
-- copied here for my own usage, selecting wait types I want to filter out.
---------------------------------------------------------------------------------------------------------

SET NOCOUNT ON;
SET TRANSACTION ISOLATION LEVEL READ UNCOMMITTED;
GO

WITH [Waits] AS
    (SELECT
        [wait_type],
        [wait_time_ms] / 1000.0 AS [WaitS],
        ([wait_time_ms] - [signal_wait_time_ms]) / 1000.0 AS [ResourceS],
        [signal_wait_time_ms] / 1000.0 AS [SignalS],
        [waiting_tasks_count] AS [WaitCount],
        100.0 * [wait_time_ms] / SUM ([wait_time_ms]) OVER() AS [Percentage],
        ROW_NUMBER() OVER(ORDER BY [wait_time_ms] DESC) AS [RowNum]
    FROM sys.dm_os_wait_stats
    WHERE [wait_type] NOT IN (
        N'BROKER_EVENTHANDLER',
        N'BROKER_RECEIVE_WAITFOR',
        N'BROKER_TASK_STOP',
        N'BROKER_TO_FLUSH',
        N'BROKER_TRANSMITTER',
        N'CHECKPOINT_QUEUE',
        N'CHKPT',
        N'CLR_AUTO_EVENT',
        N'CLR_MANUAL_EVENT',
        N'CLR_SEMAPHORE',
        N'KSOURCE_WAKEUP',
        N'LAZYWRITER_SLEEP',
        N'LOGMGR_QUEUE',
        N'MEMORY_ALLOCATION_EXT',
        N'ONDEMAND_TASK_QUEUE',
        N'PARALLEL_REDO_DRAIN_WORKER',
        N'PARALLEL_REDO_LOG_CACHE',
        N'PARALLEL_REDO_TRAN_LIST',
        N'PARALLEL_REDO_WORKER_SYNC',
        N'PARALLEL_REDO_WORKER_WAIT_WORK',
        N'PREEMPTIVE_OS_FLUSHFILEBUFFERS',
        N'PREEMPTIVE_XE_GETTARGETSTATE',
        N'PWAIT_ALL_COMPONENTS_INITIALIZED',
        N'PWAIT_DIRECTLOGCONSUMER_GETNEXT',
        N'QDS_PERSIST_TASK_MAIN_LOOP_SLEEP',
        N'QDS_ASYNC_QUEUE',
        N'QDS_CLEANUP_STALE_QUERIES_TASK_MAIN_LOOP_SLEEP',
        N'QDS_SHUTDOWN_QUEUE',
        N'REDO_THREAD_PENDING_WORK',
        N'REQUEST_FOR_DEADLOCK_SEARCH',
        N'RESOURCE_QUEUE',
        N'SERVER_IDLE_CHECK',
        N'SLEEP_BPOOL_FLUSH',
        N'SLEEP_DBSTARTUP',
        N'SLEEP_DCOMSTARTUP',
        N'SLEEP_MASTERDBREADY',
        N'SLEEP_MASTERMDREADY',
        N'SLEEP_MASTERUPGRADED',
        N'SLEEP_MSDBSTARTUP',
        N'SLEEP_SYSTEMTASK',
        N'SLEEP_TASK',
        N'SLEEP_TEMPDBSTARTUP',
        N'SNI_HTTP_ACCEPT',
        N'SOS_WORK_DISPATCHER',
        N'SP_SERVER_DIAGNOSTICS_SLEEP',
        N'SQLTRACE_BUFFER_FLUSH',
        N'SQLTRACE_INCREMENTAL_FLUSH_SLEEP',
        N'SQLTRACE_WAIT_ENTRIES',
        N'VDI_CLIENT_OTHER',
        N'WAIT_FOR_RESULTS',
        N'WAITFOR',
        N'WAITFOR_TASKSHUTDOWN',
        N'WAIT_XTP_RECOVERY',
        N'WAIT_XTP_HOST_WAIT',
        N'WAIT_XTP_OFFLINE_CKPT_NEW_LOG',
        N'WAIT_XTP_CKPT_CLOSE',
        N'XE_DISPATCHER_JOIN',
        N'XE_DISPATCHER_WAIT',
        N'XE_TIMER_EVENT',
        N'XE_LIVE_TARGET_TVF', -- xevents target
        N'CXCONSUMER' -- Just the consumer of exchange events in //
        )
	AND [wait_type] NOT IN ( -- mirroring

        N'DBMIRROR_DBM_EVENT',
        N'DBMIRROR_EVENTS_QUEUE',
        N'DBMIRROR_WORKER_QUEUE',
        N'DBMIRRORING_CMD',
        N'DIRTY_PAGE_POLL',
        N'DISPATCHER_QUEUE_SEMAPHORE',
        N'EXECSYNC',
        N'FSAGENT',
        N'FT_IFTS_SCHEDULER_IDLE_WAIT',
        N'FT_IFTSHC_MUTEX'
	)
	AND [wait_type] NOT IN ( -- AlwaysOn
        N'HADR_CLUSAPI_CALL',
        N'HADR_FILESTREAM_IOMGR_IOCOMPLETION',
        N'HADR_LOGCAPTURE_WAIT',
        N'HADR_NOTIFICATION_DEQUEUE',
        N'HADR_TIMER_TASK',
        N'HADR_WORK_QUEUE'
	)
    AND [wait_type] NOT IN ( -- 2012 only ?
        -- N'PREEMPTIVE_HADR_LEASE_MECHANISM', -- sign of lease timeout ...
        N'PREEMPTIVE_SP_SERVER_DIAGNOSTICS',
        N'PREEMPTIVE_XE_DISPATCHER'
    )
    AND [wait_type] NOT IN ( -- 2019
        N'PWAIT_EXTENSIBILITY_CLEANUP_TASK'
    )
    AND [waiting_tasks_count] > 0
    )
SELECT
    MAX ([W1].[wait_type]) AS [WaitType],
    CAST (MAX ([W1].[WaitS]) AS DECIMAL (16,2)) AS [Wait_S],
    CAST (MAX ([W1].[ResourceS]) AS DECIMAL (16,2)) AS [Resource_S],
    CAST (MAX ([W1].[SignalS]) AS DECIMAL (16,2)) AS [Signal_S],
    MAX ([W1].[WaitCount]) AS [WaitCount],
    CAST (MAX ([W1].[Percentage]) AS DECIMAL (5,2)) AS [Percentage],
    CAST ((MAX ([W1].[WaitS]) / MAX ([W1].[WaitCount])) AS DECIMAL (16,4)) AS [AvgWait_S],
    CAST ((MAX ([W1].[ResourceS]) / MAX ([W1].[WaitCount])) AS DECIMAL (16,4)) AS [AvgRes_S],
    CAST ((MAX ([W1].[SignalS]) / MAX ([W1].[WaitCount])) AS DECIMAL (16,4)) AS [AvgSig_S]
FROM [Waits] AS [W1]
INNER JOIN [Waits] AS [W2] ON [W2].[RowNum] <= [W1].[RowNum]
GROUP BY [W1].[RowNum]
HAVING SUM ([W2].[Percentage]) - MAX( [W1].[Percentage] ) < 95 -- percentage threshold
OPTION (RECOMPILE, MAXDOP 1);
You can also use the reference version from Paul Randal, tell me where it hurts.
Look for waits whose wait_type starts with LCK_M_. If they appear in the top rows of the result, or account for a significant share of the total wait time, the collection described below is worth the effort.
Blocking happening right now
If the problem is occurring while you read this, you can see the situation immediately:
-----------------------------------------------------------------
-- blocking sessions

-- rudi@babaluga.com, go ahead license
-----------------------------------------------------------------

SET NOCOUNT ON;
SET TRANSACTION ISOLATION LEVEL READ UNCOMMITTED;
GO

;WITH
    cte
    AS
    (
        SELECT DISTINCT
            CAST(ws1.wait_duration_ms / 1000.0 as decimal(10, 2)) as wait_duration_sec,
            ws1.wait_type as wait_type,
            ws1.session_id as session_id,
            ws1.blocking_session_id as blocking_session_id,
            ws1.resource_description,
            CHARINDEX('objid=',ws1.resource_description) + 6 AS resource_description_start,
            der.command,
            -- offsets are in bytes of nvarchar text, starting at 0; -1 means end of batch
            SUBSTRING(txt.text,
                (der.statement_start_offset / 2) + 1,
                ((CASE der.statement_end_offset
                    WHEN -1 THEN DATALENGTH(txt.text)
                    ELSE der.statement_end_offset
                  END - der.statement_start_offset) / 2) + 1) as text_offset,
            OBJECT_NAME(txt.objectid, der.database_id) as [proc],
            der.database_id
        FROM sys.dm_os_waiting_tasks ws1
            JOIN sys.dm_exec_sessions ses ON ws1.blocking_session_id = ses.session_id
            JOIN sys.dm_exec_requests der ON ws1.session_id = der.session_id
            OUTER APPLY sys.dm_exec_sql_text (der.sql_handle) txt

        WHERE ws1.blocking_session_id > 0
            AND ws1.blocking_session_id <> ws1.session_id
            AND ws1.wait_type LIKE 'LCK%'
            AND ses.session_id NOT IN (SELECT ws2.session_id
            FROM sys.dm_os_waiting_tasks ws2
            WHERE ws2.blocking_session_id > 0)
    ),
    cte2
    AS
    (
        SELECT wait_duration_sec
        , wait_type
        , session_id
        , blocking_session_id
        , resource_description
        , resource_description_start
        , command
        , text_offset
        , [proc]
        , database_id
        , TRY_CAST(SUBSTRING(resource_description, resource_description_start,
        CHARINDEX(' ', resource_description, resource_description_start)-resource_description_start) AS INT) AS [object_id]
        FROM cte
    )
SELECT
    *
    , DB_NAME(database_id) as [db]
	, OBJECT_NAME(object_id, database_id) AS [table]
FROM cte2
OPTION (RECOMPILE, MAXDOP 1);
The wait_duration_sec column shows how many seconds each session has been waiting, and blocking_session_id identifies the session responsible.
This is useful for putting out a fire, but it does not replace the collection: you will never run the query at the right moment.
Prerequisites
| Item | Detail |
|---|---|
| Version | SQL Server 2008 and later. For Azure SQL Database, see the section at the end of this page. |
| Permissions | ALTER ANY EVENT SESSION and VIEW SERVER STATE on the instance, plus ALTER SETTINGS (or sysadmin) to run sp_configure. |
| Restart | None. Neither changing the threshold nor creating the session requires restarting SQL Server or dropping connections. |
| Disk space | 500 MB at most in the SQL Server log directory, with the values suggested here (10 files of 50 MB). |
Not to any measurable degree. The blocked process monitor runs on the thread that already detects deadlocks, every few seconds. It takes no additional locks and adds nothing to the execution path of your queries.
The only real cost is writing events to disk, and a report is produced only when a block exceeds the threshold you set. On a healthy instance the session produces almost nothing. On an instance suffering from blocking, it produces exactly what you are trying to measure.
Simply avoid a very low threshold (under 5 seconds) on an instance that is already heavily blocked: you would generate a needlessly large volume of events without learning anything more.
Step 1 — Set the blocked process threshold
The threshold determines how many seconds of waiting make a block worth recording. While it is 0, no report is produced at all, even if the event session is running. This is the most common oversight.
EXEC sys.sp_configure N'show advanced options', N'1';
RECONFIGURE WITH OVERRIDE;
GO
EXEC sys.sp_configure N'blocked process threshold (s)', N'10';
RECONFIGURE WITH OVERRIDE;
GO
EXEC sys.sp_configure N'show advanced options', N'0';
RECONFIGURE WITH OVERRIDE;
GO
Which value should you choose?
| Value | Effect |
|---|---|
0 | Feature disabled. This is the default. |
5 | Lowest useful value. Verbose on a busy instance, but relevant if your users complain about short stalls. |
10 | The right default for a diagnostic collection. A ten-second block is already noticeable to a user. |
30 | Reports only the long, painful blocks. Use this if a threshold of 10 seconds produces too much noise. |
Start at 10. You can always adjust it later: the change takes effect immediately, without touching the event session.
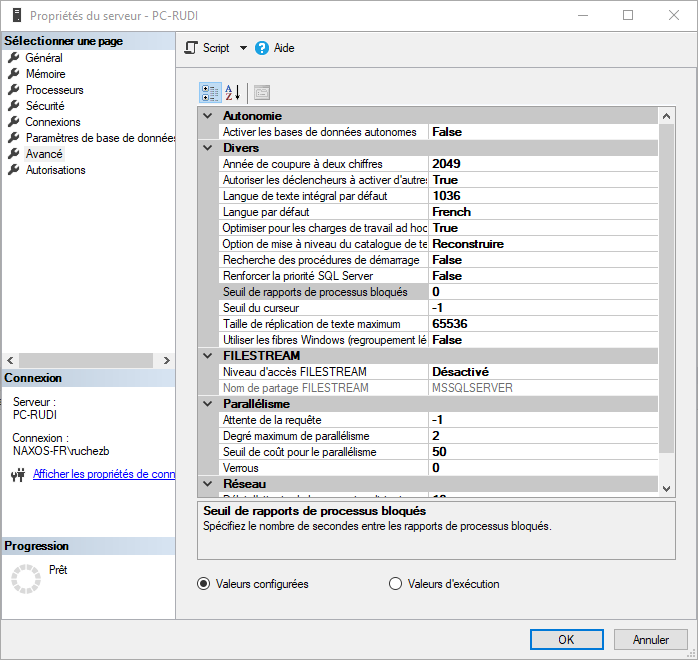
You can also configure this threshold in SSMS, in the instance properties, Advanced tab:
Step 2 — Create and start the event session
The following script contains all three operations: setting the threshold (identical to step 1), creating the session, and starting it.
-----------------------------------------------------------------
-- create the blocked process report event session
--
-- rudi@babaluga.com, go ahead license
-----------------------------------------------------------------
-- Requires: ALTER ANY EVENT SESSION, and ALTER SETTINGS (or sysadmin)
--           for the sp_configure part.
--
-- The blocked_process_report event is ONLY raised if the
-- 'blocked process threshold (s)' setting is greater than 0.
-- Step 1 is therefore mandatory.
-----------------------------------------------------------------

-----------------------------------------------------------------
-- step 1 : set the blocked process threshold
--
-- The event is raised when a session has been blocked for at
-- least this number of seconds, and then once per monitor loop
-- for as long as the block lasts.
--
-- 0  = feature disabled (default)
-- 5  = minimum useful value, verbose on a busy instance
-- 10 = good default for a diagnostic collection
-- 30 = only the long, painful blocks
-----------------------------------------------------------------
EXEC sys.sp_configure N'show advanced options', N'1';
RECONFIGURE WITH OVERRIDE;
GO
EXEC sys.sp_configure N'blocked process threshold (s)', N'10';
RECONFIGURE WITH OVERRIDE;
GO
EXEC sys.sp_configure N'show advanced options', N'0';
RECONFIGURE WITH OVERRIDE;
GO

-----------------------------------------------------------------
-- step 2 : create the session
--
-- The event file is written to the SQL Server error log
-- directory. Replace the filename with a full path
-- (N'D:\xevents\blocked_processes.xel') to write it elsewhere:
-- the SQL Server service account needs write access to it.
--
-- max_file_size    : 50 MB per file
-- max_rollover_files : 10 files kept, so 500 MB at most on disk
-----------------------------------------------------------------
CREATE EVENT SESSION [blocked_processes] ON SERVER
ADD EVENT sqlserver.blocked_process_report
ADD TARGET package0.event_file (
    SET filename = N'blocked_processes',
        max_file_size = (50),
        max_rollover_files = (10)
)
WITH (
    MAX_DISPATCH_LATENCY = 30 SECONDS,
    EVENT_RETENTION_MODE = ALLOW_SINGLE_EVENT_LOSS,
    STARTUP_STATE = OFF
);
GO

-----------------------------------------------------------------
-- step 3 : start the session
-----------------------------------------------------------------
ALTER EVENT SESSION [blocked_processes] ON SERVER STATE = START;
GO

-----------------------------------------------------------------
-- check that the session is running and where it writes
-----------------------------------------------------------------
SELECT s.name,
       s.create_time,
       CAST(t.target_data AS xml).value('(/EventFileTarget/File/@name)[1]', 'nvarchar(max)') AS current_file
FROM sys.dm_xe_sessions AS s
JOIN sys.dm_xe_session_targets AS t
    ON t.event_session_address = s.address
WHERE s.name = N'blocked_processes'
  AND t.target_name = N'event_file';

-- to stop the session and clean everything up,
-- see blocked-processes-cleanup.sql
If you have already done step 1, run only the CREATE EVENT SESSION part, then start the session:
ALTER EVENT SESSION [blocked_processes] ON SERVER STATE = START;
A few things worth knowing about this session:
- Events are written to
.xelfiles in the SQL Server error log directory. To write them elsewhere, replacefilename = N'blocked_processes'with a full path, on a drive where the SQL Server service account is allowed to write. max_file_size = 50andmax_rollover_files = 10cap disk usage at 500 MB. Beyond that, the oldest files are recycled: you lose the beginning of the collection, never the end.STARTUP_STATE = OFFmeans the session does not restart automatically if the instance restarts. If your collection has to survive a planned restart, set this option toON.
Check that the session is running and locate the current file:
SELECT s.name,
       s.create_time,
       CAST(t.target_data AS xml).value('(/EventFileTarget/File/@name)[1]', 'nvarchar(max)') AS current_file
FROM sys.dm_xe_sessions AS s
JOIN sys.dm_xe_session_targets AS t
    ON t.event_session_address = s.address
WHERE s.name = N'blocked_processes'
  AND t.target_name = N'event_file';
If this query returns no rows, the session exists but is not started.
Step 3 — Let the collection run
This is the step that takes the most patience, and the one most often cut short.
Let the session run for at least a full week, and in any case long enough to cover:
- several complete working days, at the times when users complain;
- at least one cycle of overnight processing (backups, imports, reindexing);
- if your blocking follows a business rhythm — month-end close, stocktaking, quarter end — the period concerned.
A two-hour collection on a quiet Tuesday morning generally contains nothing usable.
During this period there is nothing in particular to watch. If you want to check that events are being captured, run the read query:
-----------------------------------------------------------------
-- read the blocked process report event session
-- from the event_file target of the running session
--
-- rudi@babaluga.com, go ahead license
-----------------------------------------------------------------
-- To read .xel files collected on another instance, use
-- blocked-processes-read-file.sql instead.
-----------------------------------------------------------------

SET NOCOUNT ON;
SET TRANSACTION ISOLATION LEVEL READ UNCOMMITTED;

DECLARE @last int = 100;

-- resolve the file name pattern configured on the session,
-- so that all rollover files are read, running or not
DECLARE @configured nvarchar(1000) = (
    SELECT CAST(f.value AS nvarchar(1000))
    FROM sys.server_event_sessions AS s
    JOIN sys.server_event_session_targets AS t
        ON t.event_session_id = s.event_session_id AND t.name = N'event_file'
    JOIN sys.server_event_session_fields AS f
        ON f.event_session_id = t.event_session_id AND f.object_id = t.target_id AND f.name = N'filename'
    WHERE s.name = N'blocked_processes');

IF @configured IS NULL
BEGIN
    RAISERROR(N'The blocked_processes session does not exist, or has no event_file target.', 16, 1);
    RETURN;
END

DECLARE @file nvarchar(max) =
    CASE WHEN @configured LIKE N'%.xel' THEN REPLACE(@configured, N'.xel', N'*.xel')
         ELSE CONCAT(@configured, N'*.xel')
    END;

-- a relative file name lands in the SQL Server error log directory
IF CHARINDEX(CHAR(92), @file) = 0
    SET @file = CONCAT(
        LEFT(CAST(SERVERPROPERTY('ErrorLogFileName') AS nvarchar(max)),
             LEN(CAST(SERVERPROPERTY('ErrorLogFileName') AS nvarchar(max))) - LEN('ERRORLOG')),
        @file);

;WITH xe AS (
    SELECT ts_utc,
           XMLData,
           XMLData.query('(/event/data[@name="blocked_process"]/value/blocked-process-report)[1]') AS report
    FROM (
        SELECT timestamp_utc          AS ts_utc,
               CONVERT(xml, event_data) AS XMLData
        FROM sys.fn_xe_file_target_read_file(@file, NULL, NULL, NULL)
    ) AS src
)
SELECT TOP (@last)
       DATEADD(MINUTE, DATEDIFF(MINUTE, GETUTCDATE(), GETDATE()), xe.ts_utc) AS [local_time],
       xe.XMLData.value('(/event/data[@name="duration"]/value)[1]', 'bigint') / 1000000 AS duration_sec,
       xe.XMLData.value('(/event/data[@name="lock_mode"]/text)[1]', 'varchar(20)')      AS lock_mode,
       DB_NAME(xe.XMLData.value('(/event/data[@name="database_id"]/value)[1]', 'smallint')) AS [database],
       CONCAT(QUOTENAME(OBJECT_SCHEMA_NAME(
                  xe.XMLData.value('(/event/data[@name="object_id"]/value)[1]', 'int'),
                  xe.XMLData.value('(/event/data[@name="database_id"]/value)[1]', 'smallint'))), N'.',
              QUOTENAME(OBJECT_NAME(
                  xe.XMLData.value('(/event/data[@name="object_id"]/value)[1]', 'int'),
                  xe.XMLData.value('(/event/data[@name="database_id"]/value)[1]', 'smallint')))) AS [object],
       xe.XMLData.value('(/event/data[@name="index_id"]/value)[1]', 'int')            AS index_id,
       -- victim
       xe.report.value('(blocked-process/process/@spid)[1]', 'int')                   AS blocked_spid,
       xe.report.value('(blocked-process/process/@waittime)[1]', 'bigint') / 1000     AS blocked_wait_sec,
       xe.report.value('(blocked-process/process/@waitresource)[1]', 'nvarchar(500)') AS blocked_wait_resource,
       xe.report.value('(blocked-process/process/@isolationlevel)[1]', 'nvarchar(100)') AS blocked_isolation,
       xe.report.value('(blocked-process/process/@loginname)[1]', 'nvarchar(128)')    AS blocked_login,
       xe.report.value('(blocked-process/process/@hostname)[1]', 'nvarchar(128)')     AS blocked_host,
       xe.report.value('(blocked-process/process/@clientapp)[1]', 'nvarchar(128)')    AS blocked_app,
       xe.report.value('(blocked-process/process/inputbuf)[1]', 'nvarchar(max)')      AS blocked_input_buffer,
       -- culprit
       xe.report.value('(blocking-process/process/@spid)[1]', 'int')                  AS blocking_spid,
       -- 'sleeping' with an open transaction means the application
       -- opened a transaction and did not commit it
       xe.report.value('(blocking-process/process/@status)[1]', 'nvarchar(30)')       AS blocking_status,
       xe.report.value('(blocking-process/process/@trancount)[1]', 'int')             AS blocking_trancount,
       xe.report.value('(blocking-process/process/@transactionname)[1]', 'nvarchar(128)') AS blocking_transaction,
       xe.report.value('(blocking-process/process/@lastbatchstarted)[1]', 'nvarchar(30)')   AS blocking_last_batch_started,
       xe.report.value('(blocking-process/process/@lastbatchcompleted)[1]', 'nvarchar(30)') AS blocking_last_batch_completed,
       xe.report.value('(blocking-process/process/@loginname)[1]', 'nvarchar(128)')   AS blocking_login,
       xe.report.value('(blocking-process/process/@hostname)[1]', 'nvarchar(128)')    AS blocking_host,
       xe.report.value('(blocking-process/process/@clientapp)[1]', 'nvarchar(128)')   AS blocking_app,
       xe.report.value('(blocking-process/process/inputbuf)[1]', 'nvarchar(max)')     AS blocking_input_buffer,
       xe.report                                                                      AS blocked_process_report
FROM xe
ORDER BY xe.ts_utc DESC
OPTION (RECOMPILE, MAXDOP 1);
Step 4 — Collect and send the files
Locate the files
By default the files sit in the SQL Server error log directory. To find its exact path:
SELECT SERVERPROPERTY('ErrorLogFileName');
The result looks like C:\Program Files\Microsoft SQL Server\MSSQL16.MSSQLSERVER\MSSQL\Log\ERRORLOG. The directory is everything before ERRORLOG.
There you will find files named blocked_processes_0_<timestamp>.xel, ten at most.
Stop the session, then compress
The file currently being written can be copied while the session is running, but it is cleaner to stop the session first: you are then certain that every event has been flushed to disk.
ALTER EVENT SESSION [blocked_processes] ON SERVER STATE = STOP;
Then, from PowerShell on the server, adjusting the first two paths:
$log  = 'C:\Program Files\Microsoft SQL Server\MSSQL16.MSSQLSERVER\MSSQL\Log'
$dest = 'C:\temp\blocking'

New-Item -ItemType Directory -Path $dest -Force | Out-Null
Copy-Item -Path (Join-Path $log 'blocked_processes*.xel') -Destination $dest

Compress-Archive -Path (Join-Path $dest '*.xel') -DestinationPath 'C:\temp\blocking.zip' -Force

Get-Item 'C:\temp\blocking.zip' |
    Select-Object Name, @{ Name = 'MB'; Expression = { [math]::Round($_.Length / 1MB, 1) } }
These files compress extremely well: 500 MB of .xel commonly shrinks to a few megabytes. The archive is therefore easy to send by email or through a sharing link.
- The
blocking.ziparchive produced above. - The exact version of the instance, from
SELECT @@VERSION;. - The period covered by the collection: start date and time, end date and time.
- Your incident notes: when users reported slowness, and what they were doing.
Items 3 and 4 are the ones that save the most time during analysis. The timestamps inside the files are in UTC: state the time zone of the server so they can be lined up with your notes.
Step 5 — Clean up
Once the files have been collected and sent, remove the instrumentation. Do not do this before you have copied the files.
-----------------------------------------------------------------
-- stop and remove the blocked process report event session
--
-- rudi@babaluga.com, go ahead license
-----------------------------------------------------------------
-- Run this once the .xel files have been collected.
-- Do NOT run it before you have copied the files: dropping the
-- session does not delete them, but you lose the easy way to
-- locate them.
-----------------------------------------------------------------

-----------------------------------------------------------------
-- step 1 : stop the session
-----------------------------------------------------------------
IF EXISTS (SELECT * FROM sys.dm_xe_sessions WHERE name = N'blocked_processes')
    ALTER EVENT SESSION [blocked_processes] ON SERVER STATE = STOP;
GO

-----------------------------------------------------------------
-- step 2 : drop the session definition
-----------------------------------------------------------------
IF EXISTS (SELECT * FROM sys.server_event_sessions WHERE name = N'blocked_processes')
    DROP EVENT SESSION [blocked_processes] ON SERVER;
GO

-----------------------------------------------------------------
-- step 3 : disable the blocked process monitor
--
-- Leave this out if you want to keep raising the event for
-- another session, or for a SQL Server Agent alert.
-----------------------------------------------------------------
EXEC sys.sp_configure N'show advanced options', N'1';
RECONFIGURE WITH OVERRIDE;
GO
EXEC sys.sp_configure N'blocked process threshold (s)', N'0';
RECONFIGURE WITH OVERRIDE;
GO
EXEC sys.sp_configure N'show advanced options', N'0';
RECONFIGURE WITH OVERRIDE;
GO

-----------------------------------------------------------------
-- step 4 : the .xel files are still on disk. Delete them from
-- the operating system, or use management/delete-event-files.sql
-----------------------------------------------------------------
This script stops the session, drops its definition, and resets the blocked process threshold to 0. The .xel files stay on disk: delete them from the operating system once you no longer need them.
If on the contrary you want to keep the monitoring in place permanently, do not run this script at all: leave the threshold configured and the session recording continuously. The files recycle themselves once the 500 MB cap is reached, the cost stays low, and you will always have the history of recent blocking on the day the problem comes back. In that case, set STARTUP_STATE to ON so the session survives instance restarts.
Appendices
Reading the files yourself
You can open a .xel file directly in SQL Server Management Studio (File → Open → File), which displays the events in a grid. The full report is in the blocked_process column, as XML.
For a more readable tabular view, with the useful columns extracted from the XML:
-----------------------------------------------------------------
-- read blocked process report .xel files collected elsewhere
--
-- rudi@babaluga.com, go ahead license
-----------------------------------------------------------------
-- Use this to analyse files sent by a customer, on your own
-- instance. To read the files of a session running on the local
-- instance, use blocked-processes-read.sql instead.
--
-- Unzip the files in a directory readable by the SQL Server
-- service account of the instance you are running this on.
--
-- database_id and object_id are NOT resolved, since the metadata
-- belongs to the source instance. Use the report XML and the
-- database_id / object_id columns, or run the resolution on the
-- source instance.
-----------------------------------------------------------------

SET NOCOUNT ON;
SET TRANSACTION ISOLATION LEVEL READ UNCOMMITTED;

-------------------------------------------------------------
-- SET THE PATH TO THE .xel FILES HERE (wildcard is supported)
DECLARE @file nvarchar(max) = N'C:\temp\blocked_processes*.xel';
-------------------------------------------------------------

DECLARE @last int = 500;

-- the timestamps below are UTC, as recorded on the source
-- instance; set the offset of the source server to convert them
DECLARE @utc_offset_hours int = 0;

;WITH xe AS (
    SELECT ts_utc,
           XMLData,
           XMLData.query('(/event/data[@name="blocked_process"]/value/blocked-process-report)[1]') AS report
    FROM (
        SELECT timestamp_utc          AS ts_utc,
               CONVERT(xml, event_data) AS XMLData
        FROM sys.fn_xe_file_target_read_file(@file, NULL, NULL, NULL)
    ) AS src
)
SELECT TOP (@last)
       DATEADD(HOUR, @utc_offset_hours, xe.ts_utc)                                    AS [source_time],
       xe.XMLData.value('(/event/data[@name="duration"]/value)[1]', 'bigint') / 1000000 AS duration_sec,
       xe.XMLData.value('(/event/data[@name="lock_mode"]/text)[1]', 'varchar(20)')    AS lock_mode,
       xe.XMLData.value('(/event/data[@name="database_id"]/value)[1]', 'smallint')    AS database_id,
       xe.XMLData.value('(/event/data[@name="object_id"]/value)[1]', 'int')           AS object_id,
       xe.XMLData.value('(/event/data[@name="index_id"]/value)[1]', 'int')            AS index_id,
       xe.report.value('(blocked-process/process/@currentdbname)[1]', 'nvarchar(128)') AS blocked_database,
       -- victim
       xe.report.value('(blocked-process/process/@spid)[1]', 'int')                   AS blocked_spid,
       xe.report.value('(blocked-process/process/@waittime)[1]', 'bigint') / 1000     AS blocked_wait_sec,
       xe.report.value('(blocked-process/process/@waitresource)[1]', 'nvarchar(500)') AS blocked_wait_resource,
       xe.report.value('(blocked-process/process/@isolationlevel)[1]', 'nvarchar(100)') AS blocked_isolation,
       xe.report.value('(blocked-process/process/@loginname)[1]', 'nvarchar(128)')    AS blocked_login,
       xe.report.value('(blocked-process/process/@hostname)[1]', 'nvarchar(128)')     AS blocked_host,
       xe.report.value('(blocked-process/process/@clientapp)[1]', 'nvarchar(128)')    AS blocked_app,
       xe.report.value('(blocked-process/process/inputbuf)[1]', 'nvarchar(max)')      AS blocked_input_buffer,
       -- culprit
       xe.report.value('(blocking-process/process/@spid)[1]', 'int')                  AS blocking_spid,
       -- 'sleeping' with an open transaction means the application
       -- opened a transaction and did not commit it
       xe.report.value('(blocking-process/process/@status)[1]', 'nvarchar(30)')       AS blocking_status,
       xe.report.value('(blocking-process/process/@trancount)[1]', 'int')             AS blocking_trancount,
       xe.report.value('(blocking-process/process/@transactionname)[1]', 'nvarchar(128)') AS blocking_transaction,
       xe.report.value('(blocking-process/process/@lastbatchstarted)[1]', 'nvarchar(30)')   AS blocking_last_batch_started,
       xe.report.value('(blocking-process/process/@lastbatchcompleted)[1]', 'nvarchar(30)') AS blocking_last_batch_completed,
       xe.report.value('(blocking-process/process/@loginname)[1]', 'nvarchar(128)')   AS blocking_login,
       xe.report.value('(blocking-process/process/@hostname)[1]', 'nvarchar(128)')    AS blocking_host,
       xe.report.value('(blocking-process/process/@clientapp)[1]', 'nvarchar(128)')   AS blocking_app,
       xe.report.value('(blocking-process/process/inputbuf)[1]', 'nvarchar(max)')     AS blocking_input_buffer,
       xe.report                                                                      AS blocked_process_report
FROM xe
ORDER BY xe.ts_utc DESC
OPTION (RECOMPILE, MAXDOP 1);
This script reads files from any directory, including files coming from another instance. The SQL Server service account needs access to the directory where you unzipped them.
Understanding lock modes
In wait statistics, modes appear with the LCK_M_ prefix. In the blocked process report, the lock_mode field uses the short form, without the prefix: S, X, IX…
| Mode | Meaning | What it usually indicates |
|---|---|---|
S (LCK_M_S) | Shared lock | A read is waiting for a write to finish. A classic candidate for RCSI. |
U (LCK_M_U) | Update lock | A modification is looking for the rows to change. Often a sign of a scan caused by a missing index. |
X (LCK_M_X) | Exclusive lock | A write is waiting for another write on the same row or page. |
IS, IU, IX | Intent locks | Locks taken at higher levels (page, table) to announce an intention. IX means a session intends to write somewhere in the object. |
SCH_S | Schema stability | A query is preventing the structure of an object from changing while it uses it. |
SCH_M | Schema modification | A DDL statement, an index rebuild or a TRUNCATE TABLE is blocking everyone on the object. Check the time: this is often a maintenance job. |
RangeS-S, RangeS-U, RangeX-X | Range locks | SERIALIZABLE isolation level. A whole range of keys is locked. |
BU | Bulk update | Bulk import with TABLOCK. |
An IX or X mode awaited at the table level, when the query only modifies a handful of rows, is the symptom of lock escalation: SQL Server has converted thousands of row locks into a single table lock.
What to do with the results
The most frequent causes, in decreasing order of likelihood:
- A transaction left open by the application. In the report, the blocking session has status
sleepingwith atrancountgreater than zero: it is doing nothing but still holds its locks. The problem is in the client code, not in SQL Server. - A transaction that runs too long, going back and forth with the client, or doing unrelated work between
BEGIN TRANSACTIONandCOMMIT. - A missing index, forcing a full scan and therefore locks on rows that have nothing to do with the query.
- Reads blocking writes, under the classic
READ COMMITTEDisolation level. This is the case where enabling RCSI helps most, often without changing a line of application code. - Badly scheduled maintenance: reindexing, statistics updates or bulk imports during business hours.
The Azure SQL Database case
On Azure SQL Database the procedure differs on three points:
sp_configureis not available, and the blocked process threshold is fixed at 20 seconds, with no way to change it;- the session is created at database level (
ON DATABASE) rather than at instance level; - the target is an in-memory
ring_buffer, or a file in an Azure Blob Storage container.
--------------------------------------------------------------------
-- create blocked process report event session on Azure SQL Database
-- Blocked process threshold is set at 20, no way to change it on
-- Azure SQL.
--
-- rudi@babaluga.com, go ahead license
--------------------------------------------------------------------

CREATE EVENT SESSION [blocked_processes] ON DATABASE
ADD EVENT sqlserver.blocked_process_report
ADD TARGET package0.ring_buffer
WITH (MAX_MEMORY=4096 KB,EVENT_RETENTION_MODE=ALLOW_SINGLE_EVENT_LOSS,
    MAX_DISPATCH_LATENCY=30 SECONDS,MAX_EVENT_SIZE=0 KB,MEMORY_PARTITION_MODE=NONE,
    TRACK_CAUSALITY=OFF,STARTUP_STATE=OFF)
GO

-- start the session
ALTER EVENT SESSION [blocked_processes] ON DATABASE STATE=START;

-- stop the session, once you are done collecting
-- (a stopped session loses its ring buffer: read it first)
/*
ALTER EVENT SESSION [blocked_processes] ON DATABASE STATE=STOP;
*/
On Azure SQL Managed Instance, the procedure on this page applies as it stands.