SQL Server plan cache
Categories:
113 minute read
Co-written with Claude, who ran much of the testing and research.
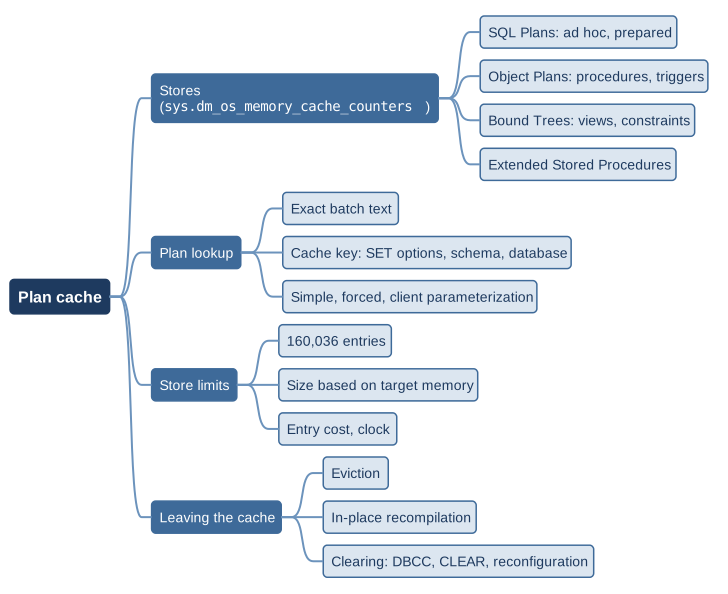
The plan cache is the part of memory where SQL Server keeps execution plans so that it does not constantly recompile the same queries. Since SQL Server 2005, it has consisted of four stores, two of which contain plans: SQL Plans for ad hoc and prepared batches, and Object Plans for procedures and triggers. You can examine them with the sys.dm_exec_cached_plans view.
An ad hoc or prepared plan is found by the exact text of its entire batch, character by character; a procedure, function, or trigger plan, by its object identifier. The engine also compares a series of attributes, the cache key, including the session’s SET options and, when a name is unqualified, the user’s default schema.
For a plan to be parameterized and serve several values, the value must be removed from the query text. The engine does this itself through simple parameterization, enabled by default but limited to queries whose plan does not depend on the value, or through forced parameterization, which you enable per database and which parameterizes almost everything. The client does it through sp_executesql with actual parameters, or by calling stored procedures. An identifier concatenated into the text, even when passed to sp_executesql, produces one plan per value.
SQL Plans and Object Plans each have two limits: a threshold of 160,036 entries, four times the 40,009 buckets in their hash table, and a size that depends on target memory. An entry has a cost, which the cache clock decreases under pressure and which rises with each reuse.
A plan leaves the cache through eviction or clearing: DBCC FREEPROCCACHE, ALTER DATABASE SCOPED CONFIGURATION CLEAR PROCEDURE_CACHE, and certain configuration changes, such as max degree of parallelism, which clear the cache for the entire instance. Invalidation, by contrast, triggers recompilation within the same entry, with the same plan_handle.
The plan cache
Before executing a query, SQL Server compiles it: it parses it, resolves object names, and then the optimizer searches for an execution plan.
For a simple query, this takes a few milliseconds; for a query joining twenty tables or an IN list of 20,000 literals, several seconds.
The plan cache (called the procedure cache in older versions) keeps the result of this work, the compiled plan, so that the next execution of the same query can use it directly.
The idea dates back to the first relational DBMS prototype. In 1981, the IBM team that had built System R and invented SQL described in A History and Evaluation of System R (Donald D. Chamberlin and fifteen coauthors, Communications of the ACM, vol. 24, no. 10, October 1981, pp. 632-646) how a program’s SQL statements were compiled once into routines collected in an access module, whose list of tables and indexes used was recorded in the catalog. A DROP INDEX marked the affected modules as invalid, and the module was recompiled on the next call, without the user noticing. Their measurement still makes the case for caching: on an IBM 370/168, for a two-table join, parsing and access path selection cost about 94 ms of CPU time, code generation 19 ms, and reading one result row 8.7 ms.
Reusing an execution plan, recording dependencies, invalidating it after a schema change, and recompiling it lazily on the next call are all things SQL Server and many relational DBMSs still do today. As in System R, the cache keeps an executable structure in memory.
In the 1990s, SQL Server 6.5 cached only stored procedure plans. Version 7.0 began keeping plans for ad hoc queries and dynamic SQL as well, and SQL Server 2005 gave the cache its current form: stores built on the common SQLOS caching framework, dynamic management views to inspect them, and statement-level recompilation instead of recompiling an entire batch or stored procedure. Later versions added further settings and features:
optimize for ad hoc workloadsin 2008,CLEAR PROCEDURE_CACHEin 2016,- Parameter Sensitive Plan (PSP) optimization in 2022,
- Optional Parameter Plan Optimization (OPPO),
- the
OPTIMIZED_SP_EXECUTESQLdatabase option in 2025.
All of this left the cache’s fundamental structure unchanged.
The cache is, of course, volatile: it disappears when the service restarts, and a plan can leave it at any time. This distinguishes it from Query Store, which keeps plans and their execution statistics in the database.
I have already covered several parts of this subject in separate articles, in French:
- Le plafond d’entrées du cache de plans for limits and eviction,
- La recompilation des plans and Les statistiques et les plans en cache for invalidation,
- Les listes IN de littéraux for parameterization and stubs.
Here I describe what the cache contains, how the engine finds a plan, what it caches, what it removes, and what clears the cache.
Most measurements were performed by Claude on disposable SQL Server 2025 CU10 (17.0.5035.5) containers running Linux, with memory limited to 2,048 MB unless otherwise stated. The main measurements were repeated on Windows Server 2019, on a 2025 CU9 (17.0.5015.4) instance. All returned the same values as on Linux.
The stores
The plan cache is not a single structure. It is a set of SQLOS cache stores, in the engine layer that manages memory and processors. Each store has its own hash table, entry counter, eviction clock, and a type name beginning with CACHESTORE_. Four stores make up the plan cache as defined in the documentation:
| Store | Type | Contents |
|---|---|---|
| SQL Plans | CACHESTORE_SQLCP | plans for ad hoc batches, automatically parameterized queries, sp_executesql, and prepared statements |
| Object Plans | CACHESTORE_OBJCP | plans for stored procedures, functions, and triggers |
| Bound Trees | CACHESTORE_PHDR | bound trees for views, constraints, and defaults |
| Extended Stored Procedures | CACHESTORE_XPROC | names and libraries of extended procedures, such as sp_executesql itself |
The SQLServer:Plan Cache performance counter objects include a fifth instance, Temporary Tables & Table Variables (CACHESTORE_TEMPTABLES), which keeps temporary tables cached by procedures. It has its own rules, which I described in La durée de vie des tables temporaires mises en cache (in French).
Query text is in the SQL Manager cache, a memory object of type MEMOBJ_SQLMGR. It follows a different eviction rule from the stores: a text entry remains as long as at least one plan references it.
You can read hash table sizes in sys.dm_os_memory_cache_hash_tables:
SELECT name, type, buckets_count, buckets_in_use_count
FROM sys.dm_os_memory_cache_hash_tables
WHERE type IN (N'CACHESTORE_SQLCP', N'CACHESTORE_OBJCP',
               N'CACHESTORE_PHDR', N'CACHESTORE_XPROC');
The SQL Plans and Object Plans hash tables have 40,009 buckets, Bound Trees has 4,001, and Extended Stored Procedures has 127.
These are prime numbers, which books on internals round to “about 40,000.”
An entry’s bucket is calculated as (object_id × database_id) mod table size, according to Sangeetha Shekar of the SQL Server programmability team in 2007, and Kalen Delaney in Microsoft SQL Server 2012 Internals.
For an ad hoc or prepared plan, object_id is a hash of the batch text. The product is calculated as an unsigned 32-bit integer, which overflows: I verified this on 36 entries (see “Plan identifiers”).
Trace flag 174 increases both plan tables to 160,001 buckets, and I measured that it also increases Bound Trees to 16,001, which is undocumented (see the article on the entry limit).
40,009 is the first prime number greater than 40,000. A prime number is useful for the modulo calculation: if the table had 40,000 buckets and database_id were 2, the product object_id × database_id would always be even; only even-numbered buckets could be reached. With 40,009, multiplying by 2 does not restrict modulo results in this way, because 2 and 40,009 are coprime.
The prime number limits this kind of concentration without guaranteeing a uniform distribution, which also depends on the hashed identifiers. The example illustrates the mathematical principle; the actual calculation includes the 32-bit overflow described above. I found no explanation published by Microsoft for the specific choice of 40,000 as the target size.
You can see the cache’s contents in the sys.dm_exec_cached_plans DMV, with one row per entry:
SELECT p.cacheobjtype, p.objtype, p.usecounts, p.size_in_bytes,
       p.plan_handle, LEFT(t.text, 80) AS text_start
FROM sys.dm_exec_cached_plans AS p
CROSS APPLY sys.dm_exec_sql_text(p.plan_handle) AS t
ORDER BY p.size_in_bytes DESC;
The cacheobjtype column gives the nature of the entry:
Compiled Planfor a compiled plan,Compiled Plan Stubfor a stub (see below),Parse Treefor a Bound Trees tree,Extended Procfor an extended procedure.
The objtype column gives its origin: Adhoc (one word, rather than “Ad hoc” as written on the Microsoft Learn documentation page for sys.dm_exec_cached_plans), Prepared, Proc, Trigger, View, Check, Default, UsrTab, SysTab, ReplProc, Rule.
After six simple batches, for example, a test database’s cache contained Adhoc entries of 16,384 bytes, an ad hoc join of 57,344 bytes, Prepared plans of 49,152 to 57,344 bytes, a procedure of 98,304 bytes, and two Extended Proc entries of 8,192 bytes, sp_executesql and xp_msver. The sp_executesql procedure is itself an extended procedure cached in XPROC. The 16,384-byte Adhoc entries contain no execution plan: they are shell queries, entries that keep the original text of a query parameterized by the engine and point to the parameterized plan (see “Simple parameterization”).
The bucketid column in sys.dm_exec_cached_plans gives the bucket number of each cached entry:
SELECT p.plan_handle, p.bucketid, p.memory_object_address,
       p.objtype, p.cacheobjtype, LEFT(t.text, 80) AS text_start
FROM sys.dm_exec_cached_plans AS p
OUTER APPLY sys.dm_exec_sql_text(p.plan_handle) AS t
ORDER BY p.bucketid, p.objtype;
To find a particular plan, you can filter on its plan_handle. The bucket number is relative to the store’s hash table: two entries in different stores can have the same bucketid. The memory_object_address column identifies the entry’s memory object, not the bucket’s address. The sys.dm_os_memory_cache_hash_tables DMV gives hash table statistics, but not the address of each bucket.
The size of an entry
For a long time I thought cached plans were large because they were stored as XML. A cached plan is actually a binary structure: a tree of engine objects linked by pointers, held in SQLOS memory objects. The XML shown by SSMS and sys.dm_exec_query_plan is generated on demand from this structure, then discarded. For fifteen plans of increasing complexity, I asked Claude to compare size_in_bytes with the size of the XML returned by sys.dm_exec_query_plan:
| Plan | size_in_bytes | XML as nvarchar | XML / size |
|---|---|---|---|
| simple parameterization shell query | 16,384 | 1,068 | 7% |
COUNT(*) on a table | 49,152 | 6,360 | 13% |
| two-table join | 81,920 | 15,670 | 19% |
| three-table join | 139,264 | 18,744 | 13% |
| nine-table join | 360,448 | 47,836 | 13% |
| three-statement procedure | 204,800 | 15,528 | 8% |
sp_executesql | 49,152 | 5,822 | 12% |
The XML is 2 to 30% of the entry’s size. Reading it changes neither size_in_bytes nor usecounts: it is not retained.
The debugger confirms this: during an execution of a cached plan, the function that builds the XML (CSQLSource::FBuildXMLShowplan, in sqllang.dll) was not called; reading sys.dm_exec_query_plan called it once.
The first two executions had called it too, but through GenerateShowplanForQDS: Query Store, enabled in the database, requested the plan for storage at compilation and, presumably for the same reason, on the next execution. To measure the entry’s size, I linked it to its constituent memory objects. memory_object_address identifies a MEMOBJ_COMPILE_ADHOC object (for all types, including Proc), and each plan has its own page allocator: the objects in sys.dm_os_memory_objects that share this allocator (page_allocator_address) add up to exactly size_in_bytes, to the byte, for all nineteen entries checked.
WITH p AS (
    SELECT cp.plan_handle, cp.objtype, cp.size_in_bytes, mo.page_allocator_address
    FROM sys.dm_exec_cached_plans AS cp
    JOIN sys.dm_os_memory_objects AS mo
      ON mo.memory_object_address = cp.memory_object_address
    WHERE cp.cacheobjtype = N'Compiled Plan'
)
SELECT p.objtype, p.size_in_bytes, m.type, COUNT(*) AS object_count,
       SUM(m.pages_in_bytes) AS bytes
FROM p
JOIN sys.dm_os_memory_objects AS m
  ON m.page_allocator_address = p.page_allocator_address
GROUP BY p.plan_handle, p.objtype, p.size_in_bytes, m.type
ORDER BY p.size_in_bytes DESC, bytes DESC;
An entry thus contains several objects whose names are undocumented; their roles can be inferred from their behavior:
| Memory object | What it contains | 2-table join | 9-table join |
|---|---|---|---|
MEMOBJ_COMPILE_ADHOC | the compiled plan | 32 KB | 104 KB |
MEMOBJ_STATEMENT | a compiled statement in a module (procedure) | ||
MEMOBJ_XSTMT | an executable statement in a multi-statement batch | ||
MEMOBJ_EXECUTE | the execution context (see the next section) | 24 KB | 104 KB |
MEMOBJ_QUERYEXECCNTXTFORSE | the part of the context specific to the storage engine | 24 KB | 144 KB |
size_in_bytes counts the plan and its cached execution contexts: for the nine-table join, 104 KB of plan and 248 KB of context. Each object allocates memory in 8 KB pages, hence sizes that are always multiples of 8,192. Only optimize for ad hoc workloads stubs (456 and 136 bytes) escape this rule: they have no memory object of their own and live in a 48 KB MEMOBJ_CACHESTORESQLCP object belonging to the store itself, which several stubs share.
The 16 KB of a shell query is a reservation in pages, but how much is consumed inside them? On a disposable SQL Server 2025 CU10 container (17.0.5035.5, Linux), I examined the two shells for SELECT value FROM dbo.ShellProbe WHERE id=42 and id=43, which share a Prepared plan. Each allocates one page for MEMOBJ_COMPILE_ADHOC and one for MEMOBJ_EXECUTE. The sys.dm_os_memory_objects DMV reports 8,192 bytes per object, but its internal bytes_used field is NULL in this test. I therefore read the size records and allocator pointers in memory, using Microsoft’s public symbols.
Here is the breakdown after the first executions, in bytes, identical for both shells:
| Object | Requested allocations | Headers and alignment | Space still available | Total |
|---|---|---|---|---|
| Compilation | 6,125 | 339 | 1,728 | 8,192 |
| Execution | 5,544 | 184 | 2,464 | 8,192 |
| Combined | 11,669 | 523 | 4,192 | 16,384 |
The allocator therefore consumes 74.4% of the two pages; 25.6% remains available within those pages. Requested sizes do not measure only useful bytes, however: a structure can contain unused fields or reserve capacity. The shared prepared plan, text cache, and global store structures are not included in these 16 KB. These figures apply to this statement and this build, without memory pressure.
The compiled plan and execution context
An entry in SQL Plans or Object Plans contains a compiled plan and its execution contexts. This distinction explains cache memory, its counters, and what happens when a hundred sessions execute the same procedure.
The program and its executions
The compiled plan is equivalent to a program: the list of operators for each statement in the batch or module, how they are connected, the parameter list, and the symbol table (declared variables and their types). It does not change from one execution to the next. It contains neither parameter values for the current execution nor the state of an execution: only the values used to compile it, visible in the XML plan (ParameterCompiledValue attribute). Nor does it fix the degree of parallelism, which is chosen at each execution: a cached parallel plan can execute serially.
Executing this program requires a workspace: the parameter values received, the local variable values, the current statement, and, for each plan operator, its current state (position in an index traversal, rows already read, hash table under construction). This is the execution context (MXC in internal sources). The documentation defines it as the data structure that “holds the data specific to an execution, such as parameter values.”
SQL Server uses a classic separation here, between reentrant code and the activation record. When Edsger Dijkstra described the implementation of recursive Algol procedures in 1960 (Recursive Programming, Numerische Mathematik, vol. 2), he separated the procedure’s code, unique and never modified, from the record each call receives on the stack, with its parameters and local variables. Code that never modifies its own instructions and stores all its state in the call’s record is called reentrant: any number of calls can execute it at the same time. The compiled plan is reentrant in the same sense: any number of sessions use it simultaneously. The execution context is the activation record for one execution: it serves only one session at a time.
One difference from a program’s stack: an activation record is destroyed when the call returns, whereas an execution context is kept. At the end of an execution, the engine does not free the context; it returns it to a list of free contexts attached to the compiled plan. The next execution takes a context from this list instead of building one. This is an object pool, the classic technique when an object is expensive to construct and cheap to keep: rebuilding a context takes a few tens of kilobytes of allocations, which are worth avoiding on each call.
Contexts do not appear in sys.dm_exec_cached_plans, which shows only the entry. They are visible in sys.dm_exec_cached_plan_dependent_objects, with one Executable Plan row per context, and three attributes in sys.dm_exec_plan_attributes count them:
misses_exec_context: the number of times an execution found no free context and had to build one;hits_exec_context: the number of times an execution reused a free context;free_exec_context: the number of free contexts at the time of reading.
SELECT a.attribute, a.value
FROM sys.dm_exec_cached_plans AS p
CROSS APPLY sys.dm_exec_sql_text(p.plan_handle) AS t
CROSS APPLY sys.dm_exec_plan_attributes(p.plan_handle) AS a
WHERE t.objectid = OBJECT_ID(N'PachadataTraining.Contact.GetContactByName')
  AND a.attribute LIKE N'%exec_context%';

SELECT d.cacheobjtype, d.usecounts, d.memory_object_address
FROM sys.dm_exec_cached_plans AS p
CROSS APPLY sys.dm_exec_sql_text(p.plan_handle) AS t
CROSS APPLY sys.dm_exec_cached_plan_dependent_objects(p.plan_handle) AS d
WHERE t.objectid = OBJECT_ID(N'PachadataTraining.Contact.GetContactByName');
A step-by-step example
To see contexts created and reused, I wrote a procedure that waits six seconds and then joins two tables, and ran it in four sessions at once, then, once all four had finished, in two.
CREATE OR ALTER PROCEDURE dbo.pB1 AS
BEGIN
    WAITFOR DELAY '00:00:06';
    SELECT COUNT(*) AS n FROM dbo.J1 AS j JOIN dbo.J2 AS k ON k.id = j.fk WHERE j.v = 3;
END;
| Time | free | misses | hits | Contexts (Executable Plan) | What happened |
|---|---|---|---|---|---|
| before | 0 | the procedure is not cached | |||
| during the wave of four sessions | 0 | 4 | 0 | 4 | no free context: each session builds one |
| after the wave | 4 | 4 | 0 | 4 | all four contexts return to the free list |
| during the wave of two sessions | 2 | 4 | 2 | 4 | each session takes a free context; none is built |
| afterward | 4 | 4 | 2 | 4 | all four contexts are still there |
The memory addresses of the four contexts stayed the same from start to finish: the wave of two reused two of the four existing contexts. The number of retained contexts therefore follows peak concurrency, four here, and does not drop when concurrency decreases. Neither does memory: for this two-table join, a context occupies 48 KB (8 KB of MEMOBJ_EXECUTE built on entry to the procedure, then 16 KB of MEMOBJ_XSTMT and 24 KB of MEMOBJ_QUERYEXECCNTXTFORSE when the SELECT executes), compared with 32 KB for the compiled plan. With four contexts, the entry grows to 224 KB, of which 192 KB is contexts. A procedure called by a hundred sessions at once keeps a hundred contexts.
One detail about usecounts, which counts successful lookups rather than executions. If the procedure is not cached when the wave begins, only one session compiles it; the other three wait for that compilation to finish (see “Plan lookup”) and receive the plan without going through a successful lookup. In the example above, usecounts was 1 after the wave of four and 3 after the wave of two. For a procedure executed once before the wave, it goes from 1 to 5.
Destroying a context
Greg Low’s white paper Plan Caching and Recompilation in SQL Server 2012 says that an error of severity 11 or higher destroys the context instead of returning it to the free list. Measurement says otherwise. I executed procedures three times in succession that perform a join, then a statement that raises an error, then a SELECT:
| Statement | Error | free | misses | hits | Context |
|---|---|---|---|---|---|
SELECT 2 | none | 1 | 1 | 2 | reused |
RAISERROR('x', 10, 1) | severity 10 message | 1 | 1 | 2 | reused |
RAISERROR('x', 16, 1) | severity 16 | 1 | 1 | 2 | reused |
SELECT 1 / @z with @z = 0 | 8134, severity 16 | 0 | 3 | 0 | destroyed every time |
THROW 50001, 'x', 1 | severity 16 | 0 | 3 | 0 | destroyed |
| duplicate primary key | 2627, severity 14 | 0 | 3 | 0 | destroyed |
SELECT 1 / @z in a TRY, caught by CATCH | none on the client | 0 | 3 | 0 | destroyed |
RAISERROR('x', 16, 1) in a TRY | none on the client | 0 | 3 | 0 | destroyed |
Severity alone therefore cannot predict context destruction. A RAISERROR outside a TRY block, even at severity 16, does not interrupt execution: it is a message sent to the client, and execution continues. An exception interrupts the current execution: an error raised by the engine, THROW, or any error that transfers control to a CATCH, even when caught, even at severity 14. The interrupted context is not returned to the list, presumably because its operators’ state is no longer guaranteed to be consistent; this is an inference, and the cause is unpublished. The practical consequence is measurable: a procedure that goes through its CATCH on every call because it uses an expected error as normal control flow rebuilds its context on every execution.
Greg Low also writes that contexts for a plan’s parallel sections are not cached, whereas those for serial sections are. A parallel plan is divided into sections delimited by exchange operators (Parallelism): the section producing the final result runs on the session thread, the others on as many additional threads as the degree of parallelism. Each thread needs its own operator state.
I observed a parallel procedure with a degree of parallelism of 4, using 12 worker threads, before, during, and after execution. Each session has a single context (Executable Plan), regardless of the number of threads. But the context’s MEMOBJ_EXECUTE object grows from 16 KB to 72 KB during execution, then returns to 16 KB at the end: these 56 KB, built on every execution and released at the end, are most likely the state of the parallel sections. Only the serial part stays cached, consistent with Low’s statement. With OPTION (MAXDOP 1), the context reaches its final size on the first execution. A parallel plan therefore incurs the cost of building its parallel sections on each execution, even when its context is reused.
Under memory pressure
According to Sangeetha Shekar of the SQL Server programmability team, in the January 16, 2007 post 9.0 Memory Pressure Limits, under memory pressure the engine can also reclaim up to half of a plan’s context memory, even when in use: a context is cheap to rebuild; a compiled plan is not. On 2025, measurement shows something different. I tracked an entry with four free contexts under the pressure described below: at the first wave of pressure, all four free contexts were released, and the compiled plan remained. A context in use kept its MEMOBJ_EXECUTE object and lost its MEMOBJ_QUERYEXECCNTXTFORSE object. Under pressure, the engine therefore first releases the memory that is cheapest to rebuild.
Plan lookup
SQL Server finds a plan in two ways, depending on the batch’s origin. In both cases, it first calculates a bucket number in the store’s hash table, then walks that bucket’s chain looking for an entry whose key matches: the object, database, and a series of session attributes, such as SET options, that form the cache key described below.
Modules and lookup by identifier
For a procedure, function, or trigger, the object is known by its object_id. The lookup takes place in Object Plans using this identifier, the database, and session attributes. If no plan matches, the engine compiles, holding an exclusive lock on the object’s COMPILE resource. This lock ensures that a procedure is compiled only once, even if a hundred sessions call it simultaneously when it is not cached.
On 2025 CU10, eight synchronized sessions called an uncached procedure whose compilation took about a second (200 joins). Only one session compiled and inserted the plan. The other seven each waited 988 ms on LCK_M_X, which sys.dm_os_waiting_tasks showed as follows:
session_id wait_type wait_duration_ms resource_description
54         LCK_M_X   302              objectlock objid=2101582525 subresource=COMPILE dbid=6 mode=X
57         LCK_M_X   300              objectlock objid=2101582525 subresource=COMPILE dbid=6 mode=X
...
The resource’s objid is the procedure’s object_id. Once the lock was released, all seven sessions executed the first session’s plan without recompiling it.
The problem this lock solves has a name in software engineering: a cache stampede, or thundering herd. When an expensive entry is missing and many callers arrive at once, each sees the absence and recalculates it, and the system does the same work n times at the worst possible moment. The classic remedy is request coalescing (Go’s singleflight package, golang.org/x/sync): the first caller computes the result, and the others wait for it. The COMPILE lock does exactly this.
Batches and lookup by text
For an ad hoc or prepared batch, there is no object identifier. The engine constructs one from the text: a 32-bit hash of the entire batch, used as the objectid in the key and in the plan_handle (see “Plan identifiers”). It looks up the text in the SQL Manager cache, then looks in SQL Plans for an entry with the same objectid whose text and key match. The match is exact, character by character: an extra space, uppercase letter, or comment makes different text, and therefore a different entry.
There is no compilation lock on this path. Sessions sending the same batch simultaneously when it is not cached each compile it, and the cache keeps every compilation. Greg Low wrote in 2012 that only one entry remains cached. On 2025 CU10, eight synchronized sessions running the same ad hoc batch left eight entries for the same text, eight different plan_handle values, each with usecounts at 1. Seven will never be used again: the next execution finds one of them, and the others wait for eviction. Eight sessions running the same sp_executesql likewise left eight Prepared entries. This is a cache stampede with no remedy.
The same text does produce the same objectid. This identifier is used to find candidate entries in the cache; it does not require that only one entry exist for that text. The sys.dm_exec_plan_attributes documentation describes it as a component of the lookup key. Other attributes, such as the database and SET options, complete this key.
Even with identical text, database, and options, two sessions can follow this sequence:
- Session A looks for the plan in the cache. It is absent, so A starts compiling.
- Before A has finished and inserted its plan, session B looks for the same plan. It also finds it absent and starts its own compilation.
- Each session finishes compiling and inserts its own entry into the cache.
The two entries then have the same objectid and lookup key, but correspond to two compilations and two separate allocations, each with its own plan_handle. The objectid therefore does not act as a uniqueness constraint. Without serialized compilation, the sequence “look up, compile, insert” can leave multiple copies for the same key. The sp_executesql documentation explicitly describes these copies when OPTIMIZED_SP_EXECUTESQL is disabled. This is what the eight simultaneous compilations in the test above show.
SQL Server 2025 added the remedy for sp_executesql, and for it alone: the OPTIMIZED_SP_EXECUTESQL database option, disabled by default.
USE PachadataTraining;
ALTER DATABASE SCOPED CONFIGURATION SET OPTIMIZED_SP_EXECUTESQL = ON;
With the option enabled, the same eight sp_executesql calls left a single Prepared entry with usecounts at 8, and seven LCK_M_X waits on a COMPILE resource. The resource’s objid matches no object in the database: it is an identifier derived from the text, like the objectid of Prepared entries. An ad hoc batch does not benefit: eight entries with or without the option. I did not measure EXECUTE (@sql), but its string is looked up as an ad hoc batch (see below).
Statements within a batch
A multi-statement batch has a single text, and therefore a single entry and compiled plan, containing each statement’s plan. The engine then collects execution statistics statement by statement in sys.dm_exec_query_stats, where each row is identified by the start and end positions of its statement in the batch text: statement_start_offset and statement_end_offset. These positions are zero-based byte offsets in nvarchar text, where each character occupies two bytes, including accented characters. To recover a character position, which is one-based for SUBSTRING, you therefore divide by two and add one.
For this three-statement batch, submitted exactly as written:
-- Query: pupil, summer number /*D1*/
SELECT COUNT(*) AS [pupils] FROM dbo.J1 j JOIN dbo.J2 k ON k.id = j.fk WHERE j.x <> 'é';
/* comment about coffee */ SELECT MAX(k.v) AS maxi FROM dbo.J2 k JOIN dbo.J3 m ON m.id = k.fk WHERE k.x <> 'à';
SELECT TOP (1) j.x FROM dbo.J1 j JOIN dbo.J3 m ON m.id = j.fk ORDER BY j.v DESC
sys.dm_exec_query_stats returns three rows, with positions 76 to 248, 308 to 472, and 478 to 634. The first SELECT begins at the 39th character of the text: 76 / 2 + 1 = 39. statement_end_offset identifies the first byte of the statement’s last character: the first statement is (248 - 76) / 2 + 1 = 87 characters long, the SELECT without its semicolon. Neither the leading comment, the comment before the second statement, nor the semicolons belong to a statement. This query extracts each statement:
SELECT qs.statement_start_offset, qs.statement_end_offset, qs.execution_count,
       SUBSTRING(t.text, qs.statement_start_offset / 2 + 1,
                 (CASE qs.statement_end_offset
                      WHEN -1 THEN DATALENGTH(t.text)
                      ELSE qs.statement_end_offset
                  END - qs.statement_start_offset) / 2 + 1) AS statement
FROM sys.dm_exec_query_stats AS qs
CROSS APPLY sys.dm_exec_sql_text(qs.sql_handle) AS t
ORDER BY qs.sql_handle, qs.statement_start_offset;
The sys.dm_exec_query_stats documentation specifies that, for versions before SQL Server 2014, statement_end_offset is -1 to indicate the end of the batch, hence the CASE. The measurement on 2025 CU10 is consistent with this restriction: none of the 192 rows in sys.dm_exec_query_stats on the test instance had -1; the final statement had its actual position. The value -1 appears in sys.dm_exec_requests for a batch’s last currently executing statement when it is not a query (a WAITFOR, for example). The CASE therefore remains useful for sys.dm_exec_requests and costs nothing elsewhere. For a module, the positions are those of the statement within the CREATE PROCEDURE text.
A lookup at each call level
Lookup happens when code executes, separately at each call level. Consider this ad hoc batch, which calls a procedure, executes a string through EXEC, and contains a query that the engine parameterizes itself:
/*E-batch*/ EXEC dbo.pE 3;
EXEC (N'SELECT MAX(k.v) AS m FROM dbo.J2 k JOIN dbo.J3 m ON m.id = k.fk /*E-dyn*/');
SELECT v FROM dbo.T WHERE id = 2;
An Extended Events session capturing sp_cache_hit, sp_cache_insert, and the start of each statement gives this order on the batch’s second execution:
| Order | Event | Object |
|---|---|---|
| 1 | sp_cache_hit | the entire batch, ADHOC |
| 2 | batch start | |
| 3 | start of EXEC dbo.pE 3 | |
| 4 | sp_cache_hit | procedure pE, PROC, by its object_id |
| 5 | start of the procedure’s statement | |
| 6 | start of EXEC (N'...') | |
| 7 | sp_cache_hit | the dynamic string, ADHOC, by its own text |
| 8 | start of the dynamic statement | |
| 9 | start of SELECT v FROM dbo.T | no lookup |
The batch is looked up once, before execution. The procedure and dynamic string are each looked up when their statement executes, as if they had been submitted alone: a procedure called ten times in a loop is looked up ten times. The parameterized query, however, was looked up only once, during batch compilation: the batch plan keeps a direct link to its prepared plan, which retained usecounts at 1 even though the statement counted two executions. The cache thus contains four entries: the batch, procedure, dynamic string, and prepared plan.
One observation about the instrument: sp_cache_miss never fired before insertion of a cacheable plan, only for uncached batches and sessions waiting for a compilation lock. You therefore cannot measure the cache miss rate by counting this event.
Plan identifiers
Four identifiers link the cache views together.
| Identifier | Calculated from | Used to |
|---|---|---|
sql_handle | the entire batch text, or module identity | retrieve the text through sys.dm_exec_sql_text |
plan_handle | the batch’s cache entry | retrieve the plan through sys.dm_exec_query_plan and remove it through DBCC FREEPROCCACHE |
query_hash | a statement’s logical tree | group statements that differ only in their literals |
query_plan_hash | the physical plan tree for a statement | group statements with the same plan |
The sql_handle and plan_handle
One sql_handle can correspond to several plan_handle values: the same text compiled under two sets of SET options, or in two databases, produces two entries. The plan_handle does not change when a statement in the batch is recompiled. It is unique among the plans currently present, but can be reused later for another plan.
Neither format is documented. But they can be decoded.
The columns are declared as varbinary(64), a variable-length type holding up to 64 bytes. Both handles measured on 2025 are 44 bytes long, on Linux and Windows alike. The diagram below gives three examples collected on 2025 CU10: the plan_handle and sql_handle of an ad hoc join executed in database 6, and a procedure’s sql_handle. Numbers are written least significant byte first (little-endian), as in memory on x64: 0600 is database 6, and DB9B4319 reads as 0x19439BDB.
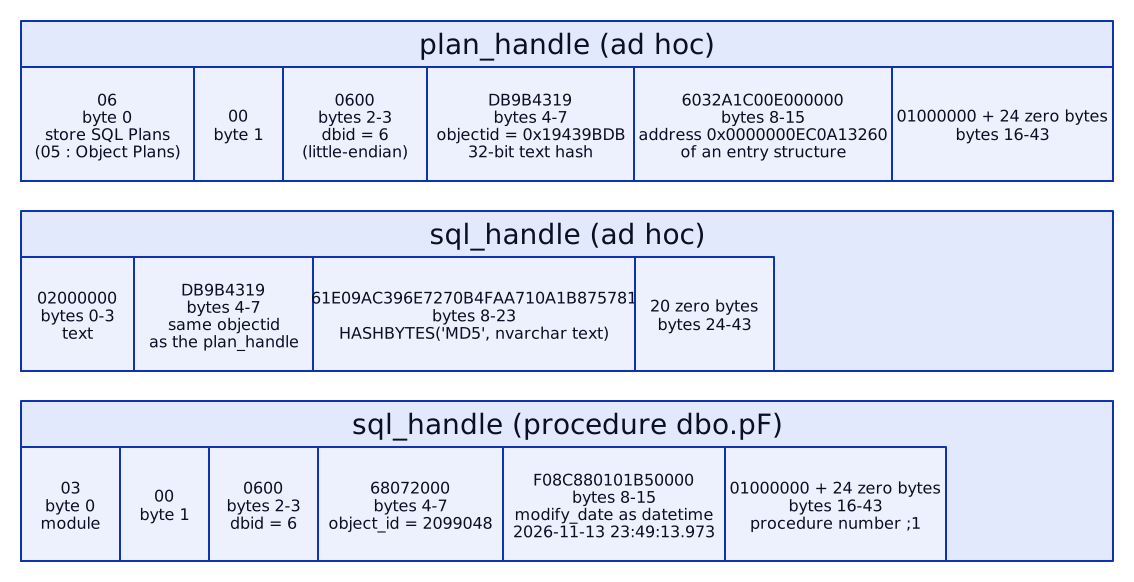
What they reveal:
- byte 0 of
plan_handleidentifies the store:06for SQL Plans (Adhoc,Prepared),05for Object Plans (procedures, functions, triggers); - bytes 2 and 3 give the database, and bytes 4 to 7 the key’s
objectidattribute: a module’sobject_idor, for a batch, a 32-bit hash of its text. This hash is neitherCHECKSUM,BINARY_CHECKSUM, nor the beginning of the text’s MD5: its function has not been identified; - bytes 8 to 15 are a memory address near the
sys.dm_os_memory_cache_entriesentry (usually 0x830 bytes before it), without being eithermemory_object_addressor the entry’s address. This is what distinguishes two entries for the same text under two sets of options: the twoplan_handlevalues differ only in these eight bytes. It also explains why aplan_handlecan be reused. In one test, the old, invalidated plan for a numbered proceduredbo.pG;1left its exactplan_handleto the new plan fordbo.pG;2, with the sameobjectid, allocated at the same address; - a batch’s
sql_handlecontains, after02000000, the sameobjectid, then exactly the result ofHASHBYTES('MD5', text)on thenvarchartext as returned bysys.dm_exec_sql_text. It depends only on the text: neither the database norSEToptions; - a module’s
sql_handlebegins with03, then contains the database,object_id, the module’s last modification date (modify_dateinsys.objects, in binarydatetimeformat), and the procedure’s number within its group (;1). AnALTER PROCEDUREtherefore changes thesql_handle, separating the statistics of the two versions.
You can verify the MD5 on any instance:
SELECT TOP (10)
       CONVERT(varchar(100), qs.sql_handle, 1) AS sql_handle,
       CONVERT(varchar(40), HASHBYTES('MD5', t.text), 1) AS text_md5
FROM sys.dm_exec_query_stats AS qs
CROSS APPLY sys.dm_exec_sql_text(qs.sql_handle) AS t
WHERE qs.sql_handle >= 0x02 AND qs.sql_handle < 0x03;
Bytes 8 to 23 of the first column (counting from 0, as in the diagram) equal the second column.
The objectid and database also determine the entry’s position in the hash table. For all 36 entries, including procedures and a trigger, bucketid was ((objectid × dbid) mod 2³²) mod 40,009: the product is calculated as an unsigned 32-bit integer, which overflows, then reduced to the number of buckets. For the join in the diagram, (423,861,211 × 6) mod 2³² mod 40,009 = 35,190. The same text in two databases therefore lands in two buckets, whereas under two sets of options it lands in the same bucket, where lookup then compares the key attributes.
The query_hash and Zobrist hashing
query_hash and query_plan_hash appeared with SQL Server 2008. Microsoft’s Bart Duncan introduced them that same year as fingerprints in his post Query Fingerprints and Plan Fingerprints: they ignore whitespace, comments, and literals, do not depend on the database or instance, and can collide. Three texts differing only in one literal thus produce three entries, three sql_handle values, and a single query_hash:
| Literal | sql_handle (start) | query_hash | query_plan_hash |
|---|---|---|---|
| 42 | 0x02000000EBE0B80E | 0x72E9689BB8C07D61 | 0x2AAACFCC4662E420 |
| 43 | 0x0200000007CED70E | 0x72E9689BB8C07D61 | 0x2AAACFCC4662E420 |
| 1 | 0x0200000077BF3138 | 0x72E9689BB8C07D61 | 0x2AAACFCC4662E420 |
The sys.query_store_query documentation defines query_hash as a Zobrist hash calculated on the bound logical query tree, the tree produced by query analysis once names have been resolved, before optimization. Albert Zobrist invented it in 1970 for chess programs (A New Hashing Method with Application for Game Playing, technical report 88, University of Wisconsin). A chess program reaches the same position by different paths and wants to recognize it without comparing piece by piece. Zobrist randomly selects, once and for all, a 64-bit number for each (piece, square) pair: 12 kinds of pieces on 64 squares, 768 numbers. The hash of a position is the exclusive OR (XOR, written ⊕) of the numbers for the pieces present:
h(position) = R[white knight, g1] ⊕ R[white king, e1] ⊕ … ⊕ R[black king, e8]
XOR has two properties that make the method useful. It is commutative, so the hash does not depend on the order in which the pieces are visited. And each number is its own inverse (x ⊕ x = 0), so playing Ng1-f3 requires only two XOR operations, without recalculating everything: h’ = h ⊕ R[white knight, g1] ⊕ R[white knight, f3]. Since the numbers are random, two different positions have the same value with a probability of about 2⁻⁶⁴.
Microsoft publishes neither what plays the role of the piece and square in a query tree nor the table of numbers. Yet the structure is visible from outside, because a Zobrist hash has a measurable property: it is linear with respect to XOR. If changing a query element amounts to removing one number and adding another, the difference between the two hashes (their XOR) depends only on the changed element, not on the rest of the query. You can read the hashes without executing the query, in the estimated plan (SET SHOWPLAN_XML ON, QueryHash attribute of the StmtSimple element). On a table dbo.Z (a, b, c, d), on 2025 CU10:
| Query | query_hash |
|---|---|
SELECT a FROM dbo.Z WHERE b = 1 | 0x7999CB2843E0BFA1 |
SELECT a FROM dbo.Z WHERE c = 1 | 0xA9FF2C4E40ED72CA |
SELECT d FROM dbo.Z WHERE b = 1 | 0x0FAE3912CBD0ECBF |
SELECT d FROM dbo.Z WHERE c = 1 | 0xDFC8DE74C8DD21D4 |
Replacing b with c in the predicate produces the same difference whether the projected column is a or d:
0x7999CB2843E0BFA1 ⊕ 0xA9FF2C4E40ED72CA = 0x0FAE3912CBD0ECBF ⊕ 0xDFC8DE74C8DD21D4 = 0xD066E766030DCD6B
You can therefore predict the fourth query’s hash without asking the engine: 0x0FAE3912CBD0ECBF ⊕ 0xD066E766030DCD6B = 0xDFC8DE74C8DD21D4. An ordinary hash function (MD5 or a polynomial hash of the text) would have no reason to produce the same difference twice. Ten out of twelve checks produced the same difference: changing the projected column, predicate column, operator (= versus >), table of the projected column, or adding a predicate always adds the same quantity by XOR. This is the signature of a Zobrist hash. The other two are the exceptions described in the next paragraph: a predicate column’s contribution depends on the table, and two predicates joined by AND cannot be deduced from single-predicate queries, because the AND changes their positions in the tree.
That leaves the “square.” In chess, the same piece does not have the same value on g1 and f3. In query_hash, the same column does not make the same contribution in the first and second positions of the SELECT list. The model h = B ⊕ P₁(x) ⊕ P₂(y), where P₁ and P₂ are a column’s contributions at each position, predicts the permutation hashes exactly: h(SELECT d, a) = h(SELECT a, a) ⊕ h(SELECT a, d) ⊕ h(SELECT d, d), verified on four combinations. Position is therefore part of the square, and this is why order matters everywhere: WHERE b = 1 AND c = 2 and WHERE c = 2 AND b = 1, SELECT a, d and SELECT d, a, Z JOIN Y and Y JOIN Z, y.b = z.b and z.b = y.b, b = 1 and 1 = b each have two different query_hash values. Equivalent queries written differently are not grouped together. One detail shows that the square is more than a position number: the difference contributed by a predicate column is not the same in two different tables, whereas that of a projected column is. A node’s “location” therefore includes at least part of its context in the tree; I have not established whether this is its complete path from the root.
The same tests reveal what goes into the piece:
Ignored by query_hash | Counted |
|---|---|
| whitespace, comments, case, brackets | table name (Z versus Z2, same structure) |
output column alias (a AS x) | schema name (dbo.T, s1.T, s2.T) |
dbo.Z versus Z when they are the same table | column names (b versus c, same type) |
literal value and type (1, 1000000, 'x', N'x', 1.5) | table alias name (t versus u) |
| a variable instead of a literal, and its type | explicit conversion (CAST(1 AS bigint)) |
the value of TOP | the number of elements in an IN list |
the table’s object_id, column column_id and type | any hint written in the text, and its value |
The hash is calculated from names, not catalog identifiers. In two databases where the same dbo.Z table has two different object_id values, and even after recreating it with its columns in a different order or one column as bigint, query_hash stayed 0x7999CB2843E0BFA1. This is what allows comparison of query_hash values across databases or instances. Literals are replaced with a neutral marker, without their type; their value never enters the hash.
Hashing in the engine code
The debugger confirms the measurement. The public symbols in sqllang.dll contain a CFingerprintUtilStatic class whose m_randomTable member is an array of 31 × 256 64-bit integers, all distinct and nonzero (the first are 0xA3AFCDBDC442EBF3, 0xB577B9B52AF851A3, 0xCA68ED0953AD020F), and functions ZobristHashBytes, ZobristHashForBool, and ZobristHashForNULL. The table has a random value for each (byte position, byte value) pair: this is the Zobrist table, applied to the bytes of a string, such as a column name, rather than pieces on squares. This is why names count and identifiers do not.
During a join’s first compilation, gdb counted 73 calls to ZobristHashBytes, 58 to ZobristHashForBool, and 47 to ZobristHashForNULL, from CFingerprintUtilEx::GenFingerprint, called by PqoBuild, the function that constructs the optimizer’s input; each logical operator adds its contribution through a ComputeHashsum method (here the aggregate’s, CLogOp_GbAgg). When the plan was reused, none of these functions was called: query_hash is calculated during compilation and kept with the plan, confirming that it is not used for lookup.
The technique has a name in hashing theory: tabulation hashing. The key is split into characters, a random value is read from a table for each character and position, and the values are combined by XOR. Zobrist invented it for chess; J. Lawrence Carter and Mark Wegman studied it as a universal hashing family as early as 1977 (STOC, published in a journal in 1979), and Mihai Pătrașcu and Mikkel Thorup showed in 2011 (The Power of Simple Tabulation Hashing, STOC) that this simple form behaves, for most uses, almost as well as an ideal hash, at the cost of a few table lookups. For an engine calculating a fingerprint at every compilation, this is a useful tradeoff: fast and composable node by node.
ComputeWstrCrc calculates a CRC on a Unicode string using the CRC-32 table (it begins with 0x00000000, 0x77073096, 0xEE0E612C, the table for polynomial 0xEDB88320). Among the hashing functions tracked, it is the only one called as often during reuse as during compilation: it could be used for lookup. I have not established that it produces a batch’s objectid: the CRC-32 of the entire text does not match, and the function reads only slices of sixteen characters.
Hints and query_hash
The sys.query_store_query page says query hints do not enter the hash. Measurement distinguishes two kinds of hints. Those written in the query text, an OPTION clause or table hint, are part of the logical tree and change query_hash, including their value:
| Query | query_hash |
|---|---|
SELECT a FROM dbo.Z WHERE b = 1 | 0x7999CB2843E0BFA1 |
same query with OPTION (MAXDOP 1) | 0x1C7CC80AC7AECA90 |
with OPTION (MAXDOP 2) | 0xFA119C4795B4AF7E |
with OPTION (RECOMPILE) | 0x227116E0CA973356 |
with WITH (NOLOCK) | 0x881E58708A60CB0F |
Those Query Store applies to an existing query through sys.sp_query_store_set_hints do not change it. I applied OPTION (MAXDOP 1) through this procedure to a join with query_hash 0x3765C48B49EA3AD0: the query was recompiled, its plan contains the QueryStoreStatementHintId attribute, and its query_hash stayed the same in sys.query_store_query, sys.dm_exec_query_stats, and the XML plan. The documentation’s statement therefore applies to Query Store hints, not those in the text. The practical consequence: adding OPTION (RECOMPILE) to application code creates a new query for Query Store, with a new history, whereas the same hint applied through Query Store preserves the history.
Kendra Little showed in 2024, on 2022 CU15, that after plan forcing, a Query Store query’s query_hash could take the value of its query_plan_hash. I did not reproduce this: on 2025 CU10, a parameterized query with two plans, one forced, kept its query_hash everywhere (Query Store, sys.dm_exec_query_stats, XML plan), and only query_plan_hash took the forced plan’s value. A single scenario does not refute her observation, which may come from a different path (automatic plan correction, another build).
The query_hash and plan lookup
The lookup described above uses the batch’s exact text (its hashed objectid, then the text) or the module’s object_id. In SQL Server Execution Plans, 3rd edition (Redgate, 2018, p. 36, “Criteria for plan reuse”), Grant Fritchey describes a lookup by QueryHash, followed by a comparison of exact text, SET options, and database. The three queries in the literals table have the same query_hash and distinct entries, but this does not refute his explanation: the text comparison he describes would be enough to separate them.
Looking up a plan by its query_hash would require knowing that hash before finding the plan. Yet in the debugger test on 2025 CU10, the functions that calculate it were called during the first compilation, then never again when the engine found and reused the plan. The test therefore shows reuse without those functions recalculating query_hash. It does not suffice to describe every lookup path or draw conclusions about the versions covered by the 2018 book.
The diagnostic use of query_hash is separate: once plans have been compiled, you can read their fingerprints in sys.dm_exec_query_stats and group statements with the same logical form, even if their text and cache entries differ:
SELECT qs.query_hash,
       COUNT(DISTINCT qs.plan_handle) AS entry_count,
       SUM(qs.execution_count) AS executions,
       SUM(qs.total_worker_time) / 1000 AS cpu_ms,
       MIN(SUBSTRING(t.text, qs.statement_start_offset / 2 + 1, 200)) AS example
FROM sys.dm_exec_query_stats AS qs
CROSS APPLY sys.dm_exec_sql_text(qs.sql_handle) AS t
GROUP BY qs.query_hash
HAVING COUNT(DISTINCT qs.plan_handle) > 1
ORDER BY entry_count DESC;
A row with hundreds of entries for a single query_hash identifies a query the application sends with its values in the text, which would benefit from parameterization.
The cache key
A cache is almost always an associative array (a dictionary): you store a value under a key and retrieve it by supplying the same key. The cache key is all the information the application compares to find a value in the cache. The term is general: the HTTP standard (RFC 9111, HTTP Caching, section 2, 2022) defines a response’s cache key as, at a minimum, the request method and URL.
The principle that determines what belongs in the key comes from memoization, named by Donald Michie in 1968 (Memo functions and machine learning, Nature, vol. 218): you can keep a function’s result and serve it again without recalculating it, provided the key contains every input on which that result depends. A plan is the result of a function, compilation, whose inputs include the text and everything that changes its meaning or the plan derived from it: the context database, SET options, language, compatibility level, and the schema used to resolve a name.
Two errors are possible.
- Leaving an input out of the key causes an incorrect plan to be served again: a plan compiled for
s1.Twould serve a user who should reads2.T. - Including an input that does not change the result creates unnecessary duplicates: this is the case with
ARITHABORT, described below.
HTTP has the same problem and the same solution: a response’s Vary header adds the request headers on which the response depends (language, encoding) to the key, just as set_options adds the session options.
The same text can therefore have several cached plans, one per combination of attributes. You can find these attributes in sys.dm_exec_plan_attributes, with the is_cache_key column:
SELECT a.attribute, a.value
FROM sys.dm_exec_cached_plans AS p
CROSS APPLY sys.dm_exec_plan_attributes(p.plan_handle) AS a
WHERE p.plan_handle = (SELECT TOP (1) plan_handle FROM sys.dm_exec_cached_plans)
  AND a.is_cache_key = 1;
On 2025 CU10, eighteen attributes have is_cache_key set to 1: acceptable_cursor_options, compat_level, date_first, date_format, dbid, dbid_execute, is_replication_specific, language_id, merge_action_type, objectid, optional_clr_trigger_dbid, optional_clr_trigger_objid, optional_spid, parent_plan_handle, required_cursor_options, set_options, status, user_id.
Kalen Delaney counted seventeen for SQL Server 2012 in Microsoft SQL Server 2012 Internals (Microsoft Press, 2013, chapter 12, “Plan caching and recompilation,” “Cache stores” section, table 12-1), without parent_plan_handle. The sys.dm_exec_plan_attributes documentation says this for objectid, status, and optional_spid, without providing the full list.
The most common in practice:
set_options, a bit field of the session’sSEToptions at compilation;user_id, the default schema when the batch contains an unqualified object name;dbid, the context database, the one specified byUSE, rather than the database containing the referenced objects;language_id,date_format, anddate_first, the language and date settings;compat_level, the compatibility level of the context database for a batch, or the database where a module was created;optional_spid, the session, when a procedure uses a temporary table it did not create: one entry per session.
SET options
I executed the same text, SELECT MAX(v) AS m FROM T;, in the same session, under eight contexts. It left eight entries, with a single sql_handle:
| Context | set_options | user_id | date_format | language_id | date_first |
|---|---|---|---|---|---|
Default sqlcmd, sa | 251 | 1 | 1 | 0 | 7 |
ANSI_NULLS OFF | 219 | 1 | 1 | 0 | 7 |
QUOTED_IDENTIFIER OFF | 187 | 1 | 1 | 0 | 7 |
ARITHABORT ON | 4,347 | 1 | 1 | 0 | 7 |
DATEFORMAT dmy | 251 | 1 | 2 | 0 | 7 |
LANGUAGE French | 251 | 1 | 2 | 2 | 1 |
User with default schema s1 | 251 | 5 | 1 | 0 | 7 |
User with default schema s2 | 251 | 6 | 1 | 0 | 7 |
The differences in set_options can be read bit by bit using the table on the sys.dm_exec_plan_attributes page: 32 for ANSI_NULLS, 64 for QUOTED_IDENTIFIER, 4,096 for ARITHABORT. LANGUAGE French also changes date_format to 2 (dmy) and date_first to 1 (Monday). According to the query processing architecture guide, the options that change the key are ANSI_DEFAULTS, ANSI_NULL_DFLT_OFF, ANSI_NULL_DFLT_ON, ANSI_NULLS, ANSI_PADDING, ANSI_WARNINGS, ARITHABORT, CONCAT_NULL_YIELDS_NULL, DATEFIRST, DATEFORMAT, FORCEPLAN, LANGUAGE, NO_BROWSETABLE, NUMERIC_ROUNDABORT, and QUOTED_IDENTIFIER. XACT_ABORT is not one of them.
In practice, the option that most often duplicates plans is ARITHABORT. SSMS opens sessions with ARITHABORT ON, most drivers with OFF. As long as ANSI_WARNINGS is ON, ARITHABORT has no effect on the result, but it remains in the key: a query copied from the application into SSMS does not find the application’s plan. It compiles another one, using the current parameter values. This is the most common cause of “slow in the application, fast in SSMS,” which Erland Sommarskog described in Slow in the Application, Fast in SSMS?.
On PachadataTraining:
USE PachadataTraining;
GO
SET ARITHABORT OFF;
GO
SELECT COUNT(*) FROM Contact.Contact AS c JOIN Contact.Company AS s ON s.CompanyId = c.CompanyId;
GO
SET ARITHABORT ON;
GO
SELECT COUNT(*) FROM Contact.Contact AS c JOIN Contact.Company AS s ON s.CompanyId = c.CompanyId;
GO
SELECT p.plan_handle, p.usecounts, a.value AS set_options
FROM sys.dm_exec_cached_plans AS p
CROSS APPLY sys.dm_exec_sql_text(p.plan_handle) AS t
CROSS APPLY sys.dm_exec_plan_attributes(p.plan_handle) AS a
WHERE t.text LIKE N'SELECT COUNT(*) FROM Contact.Contact AS c JOIN%'
  AND a.attribute = N'set_options';
In the ODBC version of sqlcmd used here, the -I option opens the connection with QUOTED_IDENTIFIER ON: double quotes then delimit object names, for example "MyTable", and character strings use single quotes. The last query returns two rows, two plan_handle values, and set_options values of 251 and 4,347 under sqlcmd -I (more if other sessions have executed the same text with other options). Without -I, this client opens its session with QUOTED_IDENTIFIER OFF, and the two values become 187 and 4,283: the client chooses the options, and therefore the key.
For a procedure, ANSI_NULLS and QUOTED_IDENTIFIER are saved with the object when it is created: they do not duplicate its plan.
SSMS places SET ANSI_NULLS and SET QUOTED_IDENTIFIER before CREATE or ALTER PROCEDURE in its generated scripts to preserve these settings, for example:
SET ANSI_NULLS ON;
GO
SET QUOTED_IDENTIFIER ON;
GO
CREATE PROCEDURE dbo.MyProcedure
AS
    SELECT 1;
GO
SQL Server saves these two options with the procedure when it is created or altered, then uses those settings for its static code on subsequent calls. The SET statements at the start of the script therefore let you recreate the procedure with the same settings, regardless of the initial configuration of the session executing the script. This behavior is described in the CREATE PROCEDURE documentation, “Interoperability” section.
This duplication has three costs, measured using the same text executed four times in the same session, under SET ANSI_DEFAULTS ON, then OFF, then ON, then OFF:
| Entry | set_options | usecounts | query_hash | query_plan_hash | Executions in sys.dm_exec_query_stats |
|---|---|---|---|---|---|
1 (ON) | 251 | 2 | 0x3765C48B49EA3AD0 | 0x636520DF98647923 | 2 |
2 (OFF) | 266 | 2 | 0x3765C48B49EA3AD0 | 0x636520DF98647923 | 2 |
The first cost is an additional full compilation: an Extended Events session recorded two sql_statement_post_compile and two sp_cache_insert events for this text, then one sp_cache_hit for each subsequent execution. The second is the memory for a second entry.
The third cost hampers troubleshooting: the four executions of the same text are split between two entries in sys.dm_exec_query_stats, each associated with a different plan_handle. Each entry counts only its two executions and their CPU and read consumption. A report grouped by plan_handle therefore shows two rows of two executions; to recover all four executions and their total cost, you must combine the statistics of both plans. The load from a single query can therefore appear lower if you examine each plan separately.
The query processing architecture guide, “Cache multiple plans for the same query” section describes this example differently. It says the second entry “doesn’t trigger a recompile” and “both entries refer to the same plan,” since they have the same query_plan_hash. This is correct in the narrow sense: there is no sql_statement_recompile event, because a recompilation, in the engine’s terminology, replaces the plan of an existing entry. But the reader concludes that duplication costs nothing, whereas it costs a compilation, an entry, and separate statistics. The same query_plan_hash only says that the optimizer arrived at the same plan shape twice.
To find these duplicates in a real cache, look for sql_handle values with several plan_handle values, and display the key attributes that separate them. Here is the script from my tsql-scripts repository:
-----------------------------------------------------------------
-- Find batch texts with multiple cached plans and compare cache keys
--
-- rudi@babaluga.com, go ahead license
-----------------------------------------------------------------
-- Read-only, instance-wide. Requires VIEW SERVER STATE before SQL Server
-- 2022, or VIEW SERVER PERFORMANCE STATE on SQL Server 2022 and later.
-- Different databases can legitimately have separate plans for the same text.
-- Source: https://www.pachadata.com/docs/articles/sqlserver/internals/cache-de-plans/

SET NOCOUNT ON;
SET TRANSACTION ISOLATION LEVEL READ UNCOMMITTED;

WITH plans AS (
    SELECT DISTINCT qs.sql_handle, qs.plan_handle
    FROM sys.dm_exec_query_stats AS qs
), duplicates AS (
    SELECT sql_handle, COUNT(*) AS plan_count
    FROM plans
    GROUP BY sql_handle
    HAVING COUNT(*) > 1
)
SELECT d.plan_count,
       DB_NAME(CAST(pa.dbid AS int)) AS database_name,
       CAST(pa.set_options AS int) AS set_options,
       CAST(pa.user_id AS int) AS user_id,
       CAST(pa.language_id AS int) AS language_id,
       cp.usecounts,
       LEFT(t.text, 70) AS text_start
FROM duplicates AS d
JOIN plans AS p ON p.sql_handle = d.sql_handle
JOIN sys.dm_exec_cached_plans AS cp ON cp.plan_handle = p.plan_handle
CROSS APPLY sys.dm_exec_sql_text(d.sql_handle) AS t
CROSS APPLY (
    SELECT dbid, set_options, user_id, language_id
    FROM (SELECT attribute, value FROM sys.dm_exec_plan_attributes(cp.plan_handle)) AS s
    PIVOT (MAX(value) FOR attribute IN (dbid, set_options, user_id, language_id)) AS pv
) AS pa
ORDER BY d.plan_count DESC, text_start, set_options
OPTION (RECOMPILE, MAXDOP 1);
On my test instance, it found all three causes: different set_options (the example above), different default schemas (user_id values 1, 5, and 6 for the same dynamic SQL, see the next section), and different databases.
The last case is not wasteful: the sql_handle does not include the database, and the same text executed in two databases must have two plans.
Look at the database_name column before drawing a conclusion.
The default schema
When an ad hoc or prepared batch names an object without its schema, FROM T instead of FROM dbo.T, the engine must resolve the name from the user’s default schema, and the plan is valid only for that schema. The user_id attribute then contains that schema. When all names are qualified, its value is -2, and the entry is shared by all users.
The sys.dm_exec_plan_attributes documentation says any value other than -2 “represents the user ID of the user submitting the query.” Measurement says otherwise. Two different users (principal_id 7 and 8), with the same default schema (schema_id 6), shared one entry, with user_id set to 6. It is the default schema, as Sangeetha Shekar wrote in 2007, Aaron Bertrand in 2014, and Erland Sommarskog. The number of entries therefore follows the number of distinct default schemas among users executing the batch. In a database where everyone has dbo as their default schema, an unqualified name does not create an additional entry, but it requires an extra resolution step, and a single user with a different default schema is enough to duplicate the plans.
Procedures follow another rule. In a procedure’s static code, a table reference without a schema, in the same database, resolves in the procedure’s schema, then in dbo. The SQL Server team describes this rule in Name resolution, default schema, implicit schema Part I, originally published on April 3, 2006, in the “Active Default Schema” passage; it specifically distinguishes dynamic SQL, which uses the current user’s default schema. The Execute a Stored Procedure documentation, “User-defined stored procedures” section, also specifies searching the enclosing procedure’s schema, then dbo, for a procedure call without a schema. To check this, I created three tables named T with different contents, dbo.T (2 rows), s1.T (3 rows), and s2.T (4 rows), and procedures that read FROM T without a schema, called by three users with different default schemas:
CREATE OR ALTER PROCEDURE dbo.P AS SELECT COUNT(*) AS row_count FROM T;
GO
CREATE OR ALTER PROCEDURE s1.P AS SELECT COUNT(*) AS row_count FROM T;
GO
CREATE OR ALTER PROCEDURE dbo.Pdyn AS EXEC (N'SELECT COUNT(*) AS row_count FROM T');
GO
CREATE OR ALTER PROCEDURE dbo.Pspx AS EXEC sp_executesql N'SELECT COUNT(*) AS row_count FROM T';
GO
-- s3.P: same procedure in a schema s3 that has no table T
EXECUTE AS USER = 'u1'; EXEC dbo.P; EXEC s1.P; EXEC dbo.Pdyn; EXEC dbo.Pspx; REVERT;
| Caller (default schema) | dbo.P | s1.P | s3.P | dbo.Pdyn (EXEC) | dbo.Pspx (sp_executesql) |
|---|---|---|---|---|---|
u1 (s1) | dbo.T | s1.T | dbo.T | s1.T | s1.T |
u2 (s2) | dbo.T | s1.T | dbo.T | s2.T | s2.T |
u3 (dbo) | dbo.T | s1.T | dbo.T | dbo.T | dbo.T |
In a procedure’s static code, FROM T refers to the same table for all callers. For example, dbo.P always reads dbo.T, and s1.P always reads s1.T, even when the caller’s default schema is s2. For s3.P, the engine looks for s3.T, then, since that table does not exist, uses dbo.T.
The three users can therefore share each procedure’s plan. In this test, each procedure has a single cache entry, with usecounts set to 3. That entry’s user_id attribute contains the identifier of the procedure’s schema: 1 for dbo, 5 for s1, 7 for s3.
With the dynamic SQL in dbo.Pdyn and dbo.Pspx, however, the table choice depends on the caller: FROM T refers to s1.T for u1, s2.T for u2, and dbo.T for u3. Each procedure keeps its own plan, but the dynamic batch it executes needs one cache entry per default schema. For each of the two dynamic texts, the test therefore left three entries, with user_id values 5, 6, and 1. A name without a schema in dynamic SQL can therefore read different tables and multiply cached plans.
Parameterization
A plan is reused only if the text is identical. An application that writes its values into the query text, WHERE EnrollmentId = 42 then WHERE EnrollmentId = 43, would therefore produce one entry per value. Three mechanisms allow a plan to be shared across values: simple parameterization, performed by the engine; forced parameterization, enabled per database; and client-parameterized queries, sp_executesql or prepared statements.
Trivial plans
A plan that gives the optimizer no choice enters the cache like any other, one entry per text. What changes is its compilation cost and its role in simple parameterization.
Before searching the possible plans, the optimizer goes through a trivial plan stage: if there is only one reasonable plan, it takes it without calculating costs.
An equality lookup on the clustered index key is the typical example: only one possible access, a Clustered Index Seek. The XML plan indicates this with the StatementOptmLevel="TRIVIAL" attribute; otherwise, it is FULL, and optimization goes through its search phases (search 0, search 1, search 2), counted by sys.dm_exec_query_optimizer_info. On PachadataTraining, where Enrollment.Enrollment has its clustered index on EnrollmentId and no index on ContactId:
| Query | StatementOptmLevel | Phase | Compilation memory | Entries left |
|---|---|---|---|---|
SELECT CreationDate FROM Enrollment.Enrollment WHERE EnrollmentId = 42 | TRIVIAL | none | 144 KB | a 16 KB shell query and a 56 KB Prepared plan |
The same with = 43 | no optimization | one additional shell query | ||
... WHERE ContactId = 42 | FULL | search 1, GoodEnoughPlanFound | 240 KB | one Adhoc entry |
The same with = 43 | FULL | search 1, again | 240 KB | a second Adhoc entry |
| Two-table join on the key | FULL | search 1 | 296 KB | one 88 KB Adhoc entry |
The two compilations took 0 to 1 ms; a join with GROUP BY, 2 ms. A trivial plan is cheap to compile, but above all it costs only once, because simple parameterization can share it: value 43 reused the prepared plan for value 42. The query on ContactId, with no index on that column, nevertheless has only one reasonable strategy, a full scan. But the nix_temp_01 index, which contains CreationDate, offers another way to read the requested column, and that cost-based choice is enough to move the optimizer to FULL. On a copy of the table without that index, the same query has a TRIVIAL plan. What matters is therefore the existence of an alternative rather than the value: as soon as the optimizer must compare costs, the plan is no longer trivial, simple parameterization gives up, and each value costs an optimization and an entry.
Simple parameterization
Simple parameterization, called autoparameterization until SQL Server 2000, is enabled by default. The engine replaces a query’s literals with parameters, compiles the parameterized form, and caches it as a Prepared plan. The original query leaves a second entry, of type Adhoc, which Greg Low’s white paper calls a shell query. It does not contain the shared plan’s operator tree: it keeps information about the original query and a reference to the prepared plan, visible in its XML plan through the ParameterizedPlanHandle attribute, added in 2008. It allows the parameterized plan to be found quickly the next time the same text arrives, without repeating parameterization. It was 16 KB in all my measurements: 8 KB for the shell’s compilation structures and 8 KB for its execution context.
A trivial plan is cheap to compile, but preparing it still requires work. To find a prepared plan from ad hoc text, SQL Server must parse that text, replace literals with parameters, normalize the statement, and convert it back into a SQL representation usable for the cache lookup. The shell query avoids repeating those steps when the same text, with the same literals, returns.
In the example below, the texts with EnrollmentId = 42 and EnrollmentId = 43 each have their own shell, but reference the same Prepared plan with EnrollmentId = @1. The prepared plan enables sharing across values; each shell allows that plan to be found quickly from the original text. The trivial nature of the plan and the shell therefore save work at different stages. This does not mean that every trivial plan requires a shell: this discussion concerns parameterization performed by the engine.
Paul White details this role in Simple Parameterization and Trivial Plans, Part 5, “Shell Plans Revisited” section, published on June 8, 2022. He explains that repeating the parameterization steps to find the prepared plan costs less than producing even a trivial plan, but remains more expensive than access through the shell, a difference that matters for very frequently executed simple statements.
A shell without an operator tree still uses fairly large compilation and execution structures. In the SQL Server 2025 CU10 measurement described above, public symbols identify a 2,448-byte CCompPlan and a 2,496-byte CStmtPrepQuery in the compiled part. The context includes a 2,192-byte CXStmtPrepQuery and another 2,120-byte block whose class I have not determined. The two 8 KB pages are therefore well used: about 12 KB is consumed by the allocator, including headers and alignment, and about 4 KB remains available.
After 100 additional executions of each text, I found two more allocations in the compiled part, of 176 and 40 bytes. With alignment, they consume another 224 bytes, still within the same page: occupancy rises to 75.8% of the 16 KB. Their function and the reason they appeared have not been determined. These observations cannot quantify how much memory a different implementation could save.
USE PachadataTraining;
GO
SELECT CreationDate FROM Enrollment.Enrollment WHERE EnrollmentId = 42;
GO
SELECT CreationDate FROM Enrollment.Enrollment WHERE EnrollmentId = 43;
GO
SELECT CreationDate FROM Enrollment.Enrollment WHERE EnrollmentId = 4242;
GO
SELECT p.objtype, p.size_in_bytes, p.usecounts, LEFT(t.text, 90) AS text_start
FROM sys.dm_exec_cached_plans AS p
CROSS APPLY sys.dm_exec_sql_text(p.plan_handle) AS t
WHERE t.text LIKE N'%Enrollment%Enrollment%EnrollmentId%'
  AND t.text NOT LIKE N'%dm_exec_cached_plans%';
On 2025 CU10, these three queries leave three 16,384-byte Adhoc shell queries and two 57,344-byte Prepared plans: (@1 tinyint)SELECT [CreationDate] FROM [Enrollment].[Enrollment] WHERE [EnrollmentId]=@1, used twice, and the same text with @1 smallint, for 4242. The parameter type follows the value: the smallest integer size that can hold it. An application whose identifiers go from 255 to 256 and then to 32,768 therefore compiles three prepared plans. The parameterized text is normalized, with brackets around names and spaces removed, allowing slightly different texts to find the same prepared plan.
The engine attempts simple parameterization only for a small class of queries. Appendix A of Greg Low’s white paper lists what prevents it: several tables in FROM, IN, UNION, TOP, DISTINCT, GROUP BY, a subquery, a common table expression, predicates connected by OR, a query hint, more than 1,000 parameters. A join is therefore never parameterized in simple mode. And even when the form allows it, the attempt succeeds only if it is considered safe.
Paul White showed in 2022, in his Simple Parameterization and Trivial Plans series, that the criterion is the optimizer’s trivial plan stage: the attempt is safe if the prepared statement gets a trivial plan, meaning a plan that does not depend on the value.
Otherwise, only the shell query remains in the cache, without a prepared plan, yet the displayed plan still keeps a parameter list, which is misleading.
In PachadataTraining, EnrollmentId = 42, on the primary key of Enrollment.Enrollment, is parameterized; ContactId = 42 on the same table, whose plan is not trivial (see “Trivial plans”), remains Adhoc, as I measured in the article on IN lists.
The Auto-Param Attempts/sec, Safe Auto-Params/sec, Unsafe Auto-Params/sec, and Failed Auto-Params/sec counters in the SQLServer:SQL Statistics object count these attempts.
Forced parameterization
Forced parameterization, introduced in SQL Server 2005, is enabled per database:
ALTER DATABASE PachadataTraining SET PARAMETERIZATION FORCED;
The engine then parameterizes almost all literals, regardless of the trivial plan, with exceptions listed in the architecture guide: the SELECT list, TOP, a LIKE pattern, the CONVERT style, hint arguments, module bodies, statements already parameterized by the client, queries with more than 2,097 literals, and those with OPTION (RECOMPILE). Strings become varchar(8000) or nvarchar(4000), and varchar(max) or nvarchar(max) beyond those sizes, integers become int, and an integer outside the limits of int, in a comparison predicate, becomes numeric(38,0). Changing the option clears the database’s plans, except those currently executing. I described its boundary in Le Query Store saturé par des identifiants concaténés (in French): an sp_executesql call with a parameter list, even an unused one, is not handled by forced parameterization.
Why does parameterization infer the type from the literal rather than use the column’s type? The choice starts in the parser, before table and column names are resolved in the metadata. At this stage, the engine knows the statement text, but not yet the type of the compared column. It recognizes an integer literal, then, in the context of a direct comparison, reduces its type to the smallest integer capable of holding its value. Paul White describes this order in Simple Parameterization and Trivial Plans, Part 4, “Statement Parsing” and “Initial Data Types” sections, published on May 20, 2022.
Even for an Id column of type int, simple parameterization can therefore produce:
| Comparison | Inferred parameter type |
|---|---|
Id = 42 | tinyint |
Id = 4242 | smallint |
Id = 424242 | int |
These different signatures can produce three distinct Prepared plans, even if their execution operators are identical. Paul White shows this duplication in part 2, “Parameter Data Types” and “Data Type Inference” sections, published on March 29, 2022. The same part explains that explicit parameterization, with a declared type matching the column’s type, avoids this variation: an @Id int parameter keeps the same type for all three values.
Using the column’s type for this comparison would therefore require a different organization of the compilation process. According to Paul White’s part 4, these inference rules date back to SQL Server 7.0 and are retained for compatibility. This is a historical implementation choice. The reduction to tinyint or smallint described here concerns simple parameterization; forced parameterization applies the different rules stated in the preceding paragraph.
Forced parameterization still leaves one Adhoc shell query per original text. It reduces the number of full compilations and plan size, and leaves one entry per text.
Client-parameterized queries
sp_executesql, statements prepared by sp_prepare, and parameterized queries from drivers produce a Prepared plan whose text starts with the parameter list, (@id int)SELECT .... That list is part of the hashed text: two calls declaring the same parameter with two different lengths have two plans.
With SqlCommand.Parameters.AddWithValue in .NET, the driver infers the parameter’s characteristics from the supplied value. For a short string, it chooses nvarchar and, if the size is not set, uses the string’s length, as stated in the SqlParameter.Size documentation. It does not consult the column definition to choose that size. Thus, "Li" produces @name nvarchar(2) and "Martin" produces @name nvarchar(6). The SELECT text is identical, but the parameter declarations differ: these calls can therefore produce two distinct Prepared plans. Explicitly declaring the type and size matching the column stabilizes this signature, as recommended in the parameter configuration documentation for Microsoft.Data.SqlClient.
The following C# example assumes a dbo.Customer.Name column of type nvarchar(100). It displays the parameter characteristics before any execution: no SQL Server connection is needed to observe the inference.
using System;
using System.Data;
using Microsoft.Data.SqlClient;

// Example: dbo.Customer.Name is an nvarchar(100) column.
const string sql = "SELECT COUNT(*) FROM dbo.Customer WHERE Name = @name;";

// AddWithValue infers the size from each value.
foreach (string name in new[] { "Li", "Martin" })
{
    using var command = new SqlCommand(sql);
    SqlParameter parameter = command.Parameters.AddWithValue("@name", name);
    Console.WriteLine($"{name}: {parameter.SqlDbType}({parameter.Size})");
}

// The type and size now match the column.
foreach (string name in new[] { "Li", "Martin" })
{
    using var command = new SqlCommand(sql);
    SqlParameter parameter = command.Parameters.Add("@name", SqlDbType.NVarChar, 100);
    parameter.Value = name;
    Console.WriteLine($"{name}: {parameter.SqlDbType}({parameter.Size})");
}
Output obtained with Microsoft.Data.SqlClient 7.1.1:
Li: NVarChar(2)
Martin: NVarChar(6)
Li: NVarChar(100)
Martin: NVarChar(100)
In the first loop, the two commands would be sent with different parameter sizes. In the second, the values change but the declaration remains @name nvarchar(100), allowing the plan to be reused if the other cache-sharing conditions are met. The number 100 comes from the column definition here; for a varchar(100) column, you would need to declare SqlDbType.VarChar with size 100.
Stored procedures and RPC calls
A stored procedure’s plan is kept in Object Plans and found by the procedure’s identifier. In 2007, Shekar recommended calling procedures through a driver RPC call rather than a batch such as EXEC dbo.Proc 1, 1000: the batch itself is ad hoc text, with its literals.
In the SQL Server 2025 CU10 test, the batch consisting solely of the EXEC dbo.Proc ... call was not cached, with reason ZeroCostPlan; the procedure’s plan was. This calling batch differs from a simple-parameterization shell query, which references a Prepared plan. This measurement cannot date a change in behavior or generalize to all batches containing an EXEC.
An RPC (Remote Procedure Call) transmits the procedure name and its typed parameters to the server. With a text batch such as EXEC dbo.Proc 1, 1000, SQL Server must first parse the statement, recognize the call, and identify the procedure before looking up its plan. RPC avoids this work on the calling batch, even when that batch would not have been cached. The engine must still find the procedure’s plan and compile it if necessary.
The Microsoft documentation on compile locks, “Stored procedure is invoked as a Language event” section, still recommends RPC for this reason. With Microsoft.Data.SqlClient, use CommandType.StoredProcedure and the procedure name as the command text. Here is an example for a dbo.Proc procedure that accepts two int parameters, @id and @threshold, with an already open connection:
using var command = new SqlCommand("dbo.Proc", connection);
command.CommandType = CommandType.StoredProcedure;
command.Parameters.Add("@id", SqlDbType.Int).Value = 1;
command.Parameters.Add("@threshold", SqlDbType.Int).Value = 1000;
command.ExecuteNonQuery();
The driver builds the RPC call from this information. The benefit concerns call processing; it does not guarantee a single plan across all session options and does not eliminate parameter sniffing.
Sharing a plan across values has a price: the optimizer can use parameter values known at compilation, often those of the first execution. This is parameter sniffing. The resulting plan can be excellent for a rare value and poor for a frequent value, or the reverse, when reused.
This sensitivity to values relates to a broader problem studied at least as early as 1992 under the name parametric query optimization: preparing several plans suited to different regions of the parameter space, then choosing at execution time. The references are:
- Yannis E. Ioannidis, Raymond T. Ng, Kyuseok Shim, and Timos K. Sellis, Parametric Query Optimization, proceedings of the 18th VLDB conference, Vancouver, 1992, pp. 103-114. In the abstract, p. 103, the authors seek several plans, “each one of which is optimal for a subset of all possible values of the run-time parameters.” Their study mainly concerns the number of buffer pages available to a query, and therefore does not specifically describe SQL Server’s parameter sniffing. The same authors published a longer version, Parametric query optimization, The VLDB Journal, vol. 6, no. 2, 1997, pp. 132-151, DOI 10.1007/s007780050037.
- Sumit Ganguly, Design and Analysis of Parametric Query Optimization Algorithms, proceedings of the 24th VLDB conference, New York, 1998, pp. 228-238. The abstract, p. 228, describes candidate plans “each optimal for some region of the parameter space.” Section 1.1 explicitly includes selectivity, table size, and available memory among the possible parameters.
SQL Server 2022 partly addresses sensitivity to values with Parameter Sensitive Plan optimization, which allows several variant plans for the same eligible parameterized statement, described below.
The optimize for ad hoc workloads option
An application that sends thousands of different ad hoc queries, each executed once, fills the cache with plans that will never be reused. The instance option optimize for ad hoc workloads, introduced in SQL Server 2008, changes what is cached on a batch’s first execution: a stub (compiled plan stub) instead of the full plan. The stub contains the cache key and a pointer to the text, without a plan. On the second execution of the same text, the engine recompiles and replaces the stub with the full plan. Since SQL Server 2019, the same setting is available per database, ALTER DATABASE SCOPED CONFIGURATION SET OPTIMIZE_FOR_AD_HOC_WORKLOADS = ON.
EXEC sp_configure 'show advanced options', 1;
RECONFIGURE;
EXEC sp_configure 'optimize for ad hoc workloads', 1;
RECONFIGURE;
Measured on 2025 CU10 for an ad hoc join that cannot be parameterized:
| Execution | cacheobjtype | size_in_bytes | usecounts |
|---|---|---|---|
| 1 | Compiled Plan Stub | 456 | 1 |
| 2 | Compiled Plan | 65,536 | 1 |
| 3 | Compiled Plan | 65,536 | 2 |
A stub is a cache entry without an execution plan. It contains the cache key (the same attributes as a full plan: set_options, dbid, user_id, objectid), a reference to the text, and the fields the store maintains for each entry, including its cost. sys.dm_exec_query_plan returns nothing for it. Unlike a plan, it has no memory object of its own: it is allocated in a 48 KB MEMOBJ_CACHESTORESQLCP object that belongs to the store and is shared by several stubs. This explains why its size is not a multiple of 8 KB and why several stubs have the same memory_object_address.
On the first execution, the engine does not save the compilation work: it compiles the entire batch, executes it with that plan, then frees the plan and keeps only the stub. The option saves memory and costs CPU. On the second execution of the same text under the same key, the lookup finds the stub, and the engine compiles again, this time to keep the plan. A query executed twice is therefore compiled twice.
The counters show this, recorded around three executions of the same join:
| Execution | Entry | Optimizations | Events |
|---|---|---|---|
| 1 | Compiled Plan Stub, 456 bytes | 1 | plan_not_cached (reason SQLStr), no sp_cache_insert |
| 2 | Compiled Plan, 73,728 bytes, different plan_handle | 1 | sp_cache_insert |
| 3 | Same plan, usecounts 2 | 0 | sp_cache_hit |
The SQL Re-Compilations/sec counter does not change: replacing a stub with a plan is not a recompilation. The first execution leaves a row in sys.dm_exec_query_stats, associated with the stub’s plan_handle. When the full plan arrives under another plan_handle, its row starts over at one execution: the first execution’s statistic is lost with the stub.
The stub’s size does not depend on the text length: 456 bytes for both a 182-byte and a 1,424-byte text, because the text is in the SQL Manager cache. The stub for the shell query of a simply parameterized query is only 136 bytes; the prepared plan is complete from the first execution, since the option does not apply to it. Finally, usecounts starts over at 1 when the plan replaces the stub: it does not count the execution that created the stub. Stub size has varied across versions: about 300 bytes according to Delaney for 2012, 424 in SQL Server Execution Plans (2018), 456 in Grant Fritchey’s SQL Server 2025 Query Performance Tuning and in my measurements on 2019 and 2025, under Linux and Windows.
The option applies only to plans compiled after it is enabled, does not clear the cache, and does not apply to Prepared plans from sp_executesql: a concatenated identifier in a client-parameterized query produces a full 48 KB plan for every value, whether the option is enabled or not. The option’s page says you can find stubs by looking for “Compiled Plan” in cacheobjtype; it is Compiled Plan Stub. To apply it to plans already in the cache, the page also suggests ALTER DATABASE SCOPED CONFIGURATION CLEAR PROCEDURE_CACHE, which clears only one database, whereas the option applies to the instance. These two points are covered by PR #10501.
A stub remains an entry in the SQL Plans hash table, with its own bucketid. My tests on SQL Server 2019, 2022, and 2025 confirm this: the 456-byte stub and the full plan replacing it are in the same bucket. The option reduces the memory allocated per entry, but stubs still count toward the number of store entries.
The 40,009 figure is the number of buckets, each of which can contain several entries. Without trace flag 174, the threshold is 160,036 entries, four times the number of buckets, according to KB3026083. A workload producing many distinct texts can therefore reach that threshold even with stubs: optimize for ad hoc workloads reduces pressure related to plan size, without eliminating pressure related to the number of entries.
The Microsoft documentation for the option, “Recommendations” section, states that you cannot view the execution plan from the cache when it contains only the stub. It recommends the option for OLTP servers where single-use ad hoc plans occupy a significant share of engine memory.
Erland Sommarskog more broadly recommends the value 1 in Slow in the Application, Fast in SSMS?, “Auto-parameterisation” section, to limit the memory consumed by applications that do not parameterize their statements. He writes: “There are no known downsides with setting the option to 1.”
I agree with him; I tend to set this option to 1 on all servers.
Plans that are not cached
Some plans are compiled without being cached. The plan_not_cached Extended Event gives the reason, from 70 values on 2025 (map plan_not_cached_reason_enum, available in sys.dm_xe_map_values). I tracked sp_cache_insert and plan_not_cached for a series of batches:
| Batch | Cached | plan_not_cached reason |
|---|---|---|
Join with OPTION (RECOMPILE) | No | SensInfo, then WithRecompile |
Procedure created WITH RECOMPILE | No | EXEC batch: ZeroCostPlan; procedure: WithRecompile (state 3) |
EXEC dbo.Proc 7 WITH RECOMPILE | No | Batch: ZeroCostPlan |
SELECT 12 AS x | No | ZeroCostPlan |
SELECT v FROM dbo.T WHERE 1 = 0 | Yes, 40,960 bytes | None |
SELECT TOP (0) v FROM dbo.T | Yes, 40,960 bytes | None |
| 7,000-character literal | Yes, 81,920 bytes | None |
| 9,000-character literal | No | ObjWithBlob |
Batch with CREATE TABLE #t, INSERT, SELECT, DROP | Yes, 131,072 bytes | Two WithRecompile events |
SELECT ... INTO dbo.copy | Yes, 73,728 bytes | None |
DROP TABLE dbo.copy | No | ZeroCostPlan |
OPTION (RECOMPILE) on an ad hoc query leaves no entry. In a procedure, it is different: the procedure’s plan stays cached, and the recompiled statement remains visible in sys.dm_exec_query_stats with its last execution, as I measured for the article on recompilation.
The sources’ “zero cost” has a precise meaning. According to my observations, it does not mean a plan whose estimated cost is zero. A query whose estimated plan costs zero but names a table, WHERE 1 = 0 or TOP (0), is cached.
The ZeroCostPlan reason applies to batches whose compilation touches no object: SELECT 12, a DROP, the EXEC proc batch. This is what I observed with the cases above.
According to my observations, the names SensInfo and SQLStr are misleading. SensInfo suggests sensitive information, but appears for OPTION (RECOMPILE) on any query: a user table, a system table, or SELECT 1 AS x OPTION (RECOMPILE) without any table.
SensInfo is given once, at batch level, when the batch contains only one statement and that statement is excluded from the cache: an OPTION (RECOMPILE) query alone, but also a CREATE PROCEDURE, an ALTER TABLE, or a USE alone in their batch. The statement then receives its own reason, WithRecompile. As soon as the batch contains another statement, a DECLARE or a second SELECT, it receives ZeroCostPlan instead of SensInfo. No source describes this reason; the rule comes from these tests.
Likewise, SQLStr does not mean that the batch is absent from the cache: it appears for a batch reading a temporary table created by a previous batch, followed in the same millisecond by an sp_cache_insert for the same batch, and for the stub from optimize for ad hoc workloads.
The two situations observed on SQL Server 2025 CU10 differ as follows:
| Situation | Observed events | Cache result |
|---|---|---|
| A query reads a temporary table created by a previous batch | plan_not_cached with SQLStr, then immediately sp_cache_insert | A full plan is retained and reused on the next execution |
First execution with optimize for ad hoc workloads enabled | plan_not_cached with SQLStr, without insertion of the full plan | Only the stub is retained |
The SQLStr reason alone therefore cannot determine the final cache state. My tests do not identify precisely the internal object or stage it refers to.
The map contains 70 reasons on 2025 CU10. Several name products that share the engine code: StretchOverViewOrTVF, DataTierOverViewOrTVF, PolarisSALSp, SynapseBlockingRules, TridentFrontEndInstance (Fabric), CopyInto, Cetas. Others refer to internal cases whose names are self-explanatory: ShowPlanOn, BulkInsert, DropStmt, LargeConst, LargeBatch, FilteredIndex, CEFeedbackHint, CursorIntQuery.
A literal longer than 8,000 bytes prevents the entire batch from being cached, according to the 2005 and 2012 white papers, with length measured after constant folding. The 9,000-character literal receives the reason ObjWithBlob, rather than LargeConst, which also exists in the map. According to Shekar and Paul White, a batch containing a sensitive statement (CREATE LOGIN, a key, a certificate, ALTER DATABASE) is not cached, even if that statement is not executed. According to the white papers, plans for queries that create or update statistics, execution contexts for a BULK INSERT, and, since 2012, plans compiled under SHOWPLAN_XML, NOEXEC, or PARSEONLY, including the estimated plans requested by SSMS, are not cached either. On 2025 CU10, SHOWPLAN_XML and PARSEONLY leave nothing, but a batch compiled under NOEXEC leaves an entry that the next execution reuses.
The uncached_sql_batch_statistics event does not mean what its name suggests. It fired for cached batches as well as rejected batches (RECOMPILE, 9,000-character literal), but not for zero-cost batches: it seems to accompany the first compilation of a batch that touches an object.
The cost of an entry
Each store entry has a cost that eviction uses to choose what to remove. You can read it in sys.dm_os_memory_cache_entries, in the original_cost and current_cost columns, joining on the memory object address:
SELECT p.objtype, p.usecounts, p.size_in_bytes,
       e.original_cost, e.current_cost
FROM sys.dm_exec_cached_plans AS p
JOIN sys.dm_os_memory_cache_entries AS e
  ON e.memory_object_address = p.memory_object_address
WHERE p.cacheobjtype = N'Compiled Plan';
The join is valid only for full plans: stubs share their memory_object_address, and each returns several rows. The entry_data column in sys.dm_os_memory_cache_entries, which contains an XML fragment for other caches, is NULL for SQL Plans and Object Plans.
Here is a standalone example with two temporary tables. The cache_entry_cost_example comment identifies only the batch being studied. GO 6, recognized by SSMS and sqlcmd, executes the same batch six times before reading its cache entry. For this measurement, optimize for ad hoc workloads is disabled and the instance is under no memory pressure.
-- Measurement with optimize for ad hoc workloads = 0, without memory pressure.
USE tempdb;
GO
CREATE TABLE #CostA (id int NOT NULL PRIMARY KEY, value int NOT NULL);
CREATE TABLE #CostB (id int NOT NULL PRIMARY KEY, value int NOT NULL);
INSERT #CostA VALUES (1, 10), (2, 20);
INSERT #CostB VALUES (1, 100), (2, 200);
GO
SELECT SUM(a.value + b.value) AS total
FROM #CostA AS a
JOIN #CostB AS b ON b.id = a.id;
-- cache_entry_cost_example
GO 6

SELECT p.objtype, p.usecounts, p.size_in_bytes,
       e.original_cost, e.current_cost
FROM sys.dm_exec_cached_plans AS p
JOIN sys.dm_os_memory_cache_entries AS e
  ON e.memory_object_address = p.memory_object_address
CROSS APPLY sys.dm_exec_sql_text(p.plan_handle) AS t
WHERE p.cacheobjtype = N'Compiled Plan'
  AND t.text LIKE N'%-- cache_entry_cost_example%'
  AND t.text NOT LIKE N'%sys.dm_exec_cached_plans%';
GO
DROP TABLE #CostA, #CostB;
Result obtained on SQL Server 2025 CU10 (17.0.5035.5, Linux) after the six executions, each returning total = 330:
objtype | usecounts | size_in_bytes | original_cost | current_cost |
|---|---|---|---|---|
Adhoc | 6 | 73,728 | 16 | 16 |
The number 16 here is the cost used to retain the entry in the cache. It represents neither a duration in milliseconds nor the estimated execution cost displayed in the plan. Plan size is another measure, size_in_bytes. The “Increase at each reuse” section shows how the cache cost rose from 0 to 16 over the executions.
Sources
The query processing architecture guide describes the cost as follows: at insertion, the current cost equals the compilation cost, or zero for an ad hoc plan; at each reuse, it is reset to the compilation cost, while an ad hoc plan’s cost increases without exceeding the compilation cost; under memory pressure, the engine decreases the cost of unused plans and removes those reaching zero. Other sources agree on neither the measure nor the decrease:
| Source | Compilation cost | Reused ad hoc plan | Decrease under pressure |
|---|---|---|---|
| Arun Marathe (2005), Greg Low (2008, 2012) | Sum of ticks, at most 31: one per two I/Os (at most 19), one per two context switches (at most 8), one per 16 memory pages (at most 4) | Not specified | One tick less on each access after 50% of the buffer pool |
| Delaney (2012) | Same caps, one tick per I/O and per context switch | Plus 1 at each reuse | One tick less on each access after 50% of the buffer pool; halved under memory pressure |
| Korotkevitch (2014) | As in Delaney | Plus 1 at each reuse | One less at each lazy writer pass |
| Shekar (2007) | Two raised to the sum of the contributions, caps of 19, 8, and 4 | Reset to original cost on first reuse, maximum cost 4 | Halved |
| Slava Oks (2005) | Not specified | Not specified | Decreased each time the clock hand passes an unused entry, removed at 0 |
Several books, from Professional SQL Server 2005 Performance Tuning (2008) to Grant Fritchey’s SQL Server Execution Plans, 3rd edition (2018, p. 35, “Plan aging”), still describe an “age” equal to the cost multiplied by the use count and decremented by the lazy writer. This is the SQL Server 2000 model, replaced in 2005 by the clock.
In SQL Server 2025 Query Performance Tuning, 7th edition (Apress, 2026), Grant Fritchey still describes an age field initialized to the plan generation cost, restored to that cost on reuse, and periodically examined by the lazy writer (chapter 2, “Aging of the Execution Plan,” pp. 37-38). He does not repeat the multiplication by the use count. However, the initial compilation-related cost does not match the DMV values measured below on SQL Server 2025. This comparison requires confirmation that the field described in the book and the DMV columns represent the same internal cost.
Increase at each reuse
On 2025 CU10, without any memory pressure, I executed an ad hoc join and a procedure twelve times, recording both costs after each execution:
| Execution | 1 | 2 | 3 | 4 | 5 | 6 | 7 to 12 |
|---|---|---|---|---|---|---|---|
original_cost and current_cost | 0 | 1 | 2 | 4 | 8 | 16 | 16 |
The sequence is the same for an Adhoc plan, a Prepared plan from sp_executesql, and a Proc plan, and the same for a 288 KB ad hoc plan joining nine tables: it doubles and caps at 16, regardless of plan size. original_cost grows with current_cost and remains equal to it. On PachadataTraining, a join between Contact.Contact and Contact.Company executed seven times was also at 16.
In the tests presented here, the original_cost and current_cost columns start at zero for Adhoc, Prepared, and Proc plans, then increase with reuse. The same sequence appears for plans of different sizes. The same values occur under Windows, on 2025 CU9.
This result differs from the description in the Microsoft guide, “Remove execution plans from the plan cache” section, which reserves a zero initial cost for ad hoc plans and describes, for other plans, an initial compilation cost restored at each reuse. This is a candidate for a documentation correction. Before proposing a replacement formula, earlier versions must still be checked, and the correspondence between the costs exposed by the DMV and the compilation cost described in the guide must be confirmed. These tests are not enough to establish a general rule that cost is independent of plan size.
Decrease under pressure
A clock hand is a pointer that traverses the entries of a cache store. At each pass, the engine can decrease an unused entry’s cost or remove it if its cost is already zero. We will see how this works below.
To see the cost decrease, the clock must move. Into an empty cache, I placed ad hoc joins executed one to seven times, with costs of 0, 1, 2, 4, 8, and 16, a prepared plan and a procedure costing 16, then inserted thousands of distinct ad hoc batches, recording the costs every twenty insertions. At around 540 MB of SQL Plans, with max server memory at 2,048 MB, the resource monitor reported low physical memory at process level (RESOURCE_MEMPHYSICAL_LOW in sys.dm_os_ring_buffers), and the external clock hand moved across all stores at once:
| External clock hand pass | M16 | M8 | M4 | M2 | M1 | M0 | Procedure at 16 |
|---|---|---|---|---|---|---|---|
| Before | 16 | 8 | 4 | 2 | 1 | 0 | 16 |
| 1 | 8 | 4 | 2 | 1 | 0 | Removed | 8 |
| 2 | 4 | 2 | 1 | 0 | Removed | 4 | |
| 3 | 2 | 1 | 0 | Removed | 2 | ||
| 4 | 1 | 0 | Removed | 1 | |||
| 5 | 0 | Removed | 0 | ||||
| 6 | Removed | Removed |
Each clock hand pass halves the current cost, using integer division, and removes any entry it finds at zero. original_cost does not change during the decrease. An entry at 16 therefore survives five passes, a single-use entry none. A procedure in Object Plans follows the same sequence. An entry currently executing is never removed, even at cost 0: a tracked query survived seventy clock hand passes without being removed. Reuse during pressure resets the cost to 16, whether it had fallen to 8 or 2: the entry recovers its entire margin at once. In a final test where pressure removed everything in less than a second, the query_cache_removal_statistics Extended Event timestamped each tracked entry’s removal: M0, then M1, M2, M4, M8, at two-millisecond intervals, then all those at 16 together. Entries leave in cost order.
This is Shekar’s halving (2007), already described for external pressure by Delaney in Inside Microsoft SQL Server 2005, rather than the one-tick decrement described by Low and Korotkevitch.
Engine code
The engine has public symbols, and its functions can be seen in a debugger. Under Linux, I attached gdb to the test instance’s process, read function addresses from the symbol files (PDBs) Microsoft publishes, and counted calls during a wave of pressure. Three functions in sqldk.dll, the SQLOS library, explain the observations above:
CacheClockAlgorithm::CalculateCostcalculates an entry’s cost from compilation ticks and a term related to the number of memory pages. This term is calculated by dividing the page count by 16 using integer division, then capping the result at 4: 32 pages give 2, and 64 pages or more give 4. In machine code, division by 16 is a four-bit right shift. These are what Marathe and Low describe; I have not established how they combine with the sequence 0, 1, 2, 4, 8, 16 measured at each reuse;TCacheStore::MoveInternal, the clock hand step, reads a 64-bit word from each entry’s clock structure (ClockInfo). It compares the low half with 1 and halves the high half (shr eax, 1instruction) before writing it back with an atomic write (lock cmpxchg). Everything is consistent with the high half being the current cost and the low half marking the entry as in use, which would explain the measured halving and the fact that an entry in use is never removed; read in the code, not verified in an entry’s memory;- the call chain, read from the stacks, starts at the resource monitor:
ResourceMonitorTask,CheckIndicators,NotifyMemoryConsumers,TCacheStore::Notify,StartExternalPressure,CacheClockHand::Move, thenMoveInternal. During a pass that removed 2,752 SQL Plans entries,MoveInternalwas called 460 times: it processes several entries per call.
The MoveInternal passage brings together several classic systems programming techniques:
- Counter aging gradually reduces the weight of older uses. Shifting an unsigned integer one bit to the right halves it, discarding the remainder:
16,8,4,2,1,0. In the classic page replacement algorithm, a recent-use bit is also inserted at the left of the counter. Redha Gouicem’s course at RWTH Aachen, “LRU Approximation With Aging” section, describes this mechanism. The reuse rule observed in SQL Server differs from this bit insertion. - Packing several fields into a single integer allows a counter and a state to be checked and modified together. PostgreSQL uses this technique in its buffer manager:
buf_internals.hpacks a reference count, a usage count, and flags into a 32-bit word. The code comment explains that this packing allows certain atomic updates through a compare-and-swap loop. - Atomic compare-and-swap (CAS) allows a value to be replaced only if it still matches the expected value. If another thread changed it between the read and the attempted write, the swap fails; a loop can then reread the value and repeat the calculation. This avoids overwriting a concurrent change. Mara Bos explains this technique and the x86
lock cmpxchginstruction in Rust Atomics and Locks, chapter 7, “x86 compare-and-exchange instruction”.
These references explain the general techniques. They do not document ClockInfo: interpreting its two halves as current cost and usage state remains a hypothesis derived from reading the SQL Server code.
Removal itself goes through plan destruction (CCacheObject::Destroy, then the ~CCompPlan destructor), which fires the query_cache_removal_statistics event. It does not go through the function that fires sp_cache_remove: that function is called only for explicit removals, DBCC FREEPROCCACHE, DBCC FREESYSTEMCACHE, and database options. An event session tracking sp_cache_remove therefore sees no evictions: during a test where query_cache_removal_statistics fired 8,241 times, it received nothing. (query_cache_removal_statistics is also emitted when a plan that was not cached is freed at the end of a batch.)
SQL Server provides no documented native counter equivalent to Page life expectancy (PLE) for the plan cache. The SQLServer:Plan Cache performance object exposes the object count, size, and lookup hit rate, among other things, but no residence time.
The views and events nevertheless allow several aspects to be measured:
| Information sought | Available method |
|---|---|
| How long a procedure plan has been cached | cached_time in sys.dm_exec_procedure_stats |
| When a statement was compiled | creation_time in sys.dm_exec_query_stats; a recompilation renews this timestamp, so it does not necessarily measure the entry’s residence time |
| When a plan disappears | Capture removals, particularly with query_cache_removal_statistics, and correlate them with prior plan tracking, accounting for the events fired for uncached plans described above |
To build a general indicator, you can periodically record plan_handle values with their first and last observations. This estimates the residence time of observed plans, separating, for example, single-use plans from reused plans. Plans already present when tracking starts have an unknown initial age; those still present at the end have not completed their stay. Plans created and removed between two samples escape this measurement entirely.
The average age of only the plans currently present would be misleading: it ignores those quickly evicted. A few old plans can therefore hide significant cache turnover. The current cost described in this section is not a duration in seconds either: it determines an entry’s resistance to clock hand passes.
Consequences
In practice, a plan becomes harder to remove at each reuse, up to the fifth, and a single-use plan is at zero, so it is removed on the first clock hand pass. The cost does not say how much the plan cost to compile, but how many more passes it can survive, on a powers-of-two scale. My tests on 2019 support this: plans called every 20 seconds survived nearly 78,000 evictions.
As we saw in a previous blog post, this pattern has a name in the operating systems literature: aging, described by Andrew Tanenbaum for page replacement. Each page has a counter; at each clock tick, the counter is shifted one bit to the right, halving it, and the page’s usage bit is added on the left. A page used recently and often has a large counter; a forgotten page sees its counter shrink by halves. SQL Server does the same thing, with two differences: the cost doubles at each reuse instead of receiving a bit, and division happens only when a clock hand passes, meaning under pressure.
Eviction
The SQLOS caching framework removes entries using a clock algorithm. Each store has two clock hands, visible in the sys.dm_os_memory_cache_clock_hands view:
- the internal hand (
HAND_INTERNAL) moves when the store itself exceeds one of its limits, entry count or size; worker threads inserting into the cache move it, which lengthens their queries; - the external hand (
HAND_EXTERNAL) moves when the entire instance is short of memory; the Resource Monitor moves it.
The Microsoft guide distinguishes global pressure, handled by the Resource Monitor, from pressure within a cache, handled by worker threads.
Each time the hand passes an unused entry, it halves its current cost; an entry at zero is removed (see “Decrease under pressure”). An entry in use is never removed, except when marked with DBCC FREESYSTEMCACHE ... WITH MARK_IN_USE_FOR_REMOVAL, which removes it as soon as it becomes available. According to Delaney, one pass updates at most 16 entries per store; Shekar adds that under local pressure, this number doubles with each movement of the hand, up to 1,024.
SELECT c.name, h.clock_hand, h.clock_status, h.rounds_count,
       h.removed_all_rounds_count, h.removed_last_round_count
FROM sys.dm_os_memory_cache_clock_hands AS h
JOIN sys.dm_os_memory_cache_counters AS c
  ON c.cache_address = h.cache_address
WHERE c.type IN (N'CACHESTORE_SQLCP', N'CACHESTORE_OBJCP');
The tests show when each hand intervenes:
- On SQL Server 2019, SQL Plans reached its entry limit. The internal hand removed 39,975 entries, according to
removed_all_rounds_count. The external hand’s counter stayed at zero: only SQL Plans needed to free up space. - On SQL Server 2025 on Windows, SQL Plans reached its size limit (see “The limits of a store”). The internal hand halved the costs, just like the external hand:
16,8,4,2,1over five passes. - Both hands change the same cost for a given entry. In this Windows test, one pass of the external hand lowered the cost from
1to0. The internal hand then removed the entry. - The internal hand acts only on its own store. During the five passes of the SQL Plans hand, a procedure kept in Object Plans remained at a cost of
16. - On SQL Server 2025 in a Linux container limited to 3 GB, the result was different. With
max server memoryat 2,048, 1,500, or 800 MB, the growth of SQL Plans triggered process memory pressure (RESOURCE_MEMPHYSICAL_LOW) before the store reached its own limit. The external hand then swept all the stores, while the internal hand made no passes.
Waves of pressure do not all have the same intensity. In my tests, one wave could cause one or two passes, after which memory stabilized. The next could cause seven in less than a second. Target memory fell from 1.7 GB to 500 MB before rising again.
The mechanism observed in SQL Server can be compared with several page replacement and cache management algorithms.
The clock and GCLOCK
The clock algorithm visits entries in circular order. A bit indicates whether each entry has been used recently: the sweep gives used entries a second chance and can remove the others. This mechanism approximates LRU (Least Recently Used) behavior without having to reorder a list on every access. Fernando J. Corbató describes it for Multics in A Paging Experiment with the Multics System, published in 1969, pp. 217-228.
GCLOCK generalizes this idea by replacing the bit with a counter. In a common form, each pass decrements the counter by one until the entry can be removed. Victor F. Nicola, Asit Dan, and Daniel M. Dias analyze this family in Analysis of the Generalized Clock Buffer Replacement Scheme for Database Transaction Processing, SIGMETRICS, 1992.
Aging
Halving a counter gradually reduces the weight of older uses. This is the principle of aging described by Andrew S. Tanenbaum and Herbert Bos in Modern Operating Systems, 5th edition, chapter 3. Redha Gouicem’s course at RWTH Aachen explains shifting the counter to the right and adding a recent-use bit on the left.
In my SQL Server tests, the halving occurs when a clock hand passes. However, the update on reuse follows a different rule from adding this bit, as the sequence measured earlier shows.
Reload cost
Cache entries do not all cost the same to recreate. GreedyDual accounts for the cost of cache misses: Neal E. Young presents it in On-Line Caching as Cache Size Varies, SODA, 1991. Pei Cao and Sandy Irani extend this approach to web caches with GreedyDual-Size in Cost-Aware WWW Proxy Caching Algorithms, USITS, 1997, pp. 193-206, also accounting for object size.
This question also applies to plans: removal requires another compilation on a subsequent call, and compilation cost varies with the query. However, this analogy is not enough to infer the formula SQL Server uses.
The comparison with SQL Server
The observations combine several characteristics:
- a circular sweep of entries, as in clock algorithms;
- a counter that decreases through integer division by two, as in aging;
- a cost that rises on reuse, giving reused entries a better chance of remaining in cache.
These comparisons are my interpretation of the measurements and observed code. They do not establish that SQL Server implements GCLOCK, conventional aging, or GreedyDual exactly. Similarly, the term “LRU” used by Slava Oks and Sangeetha Shekar refers here to an approximate policy: it does not imply that the engine always removes the plan whose last use is the oldest.
The limits of a store
A store has two limits, both of which trigger the internal hand. I covered them in detail in the article on the entry limit; here are the main points.
The first is an entry count: four times the number of hash table buckets, or 160,036 entries for SQL Plans and for Object Plans, each separately. This is the value given by KB3026083. When the entry count reaches this threshold, the engine starts removing entries to free up space. New entries can still arrive during this cleanup, so the observed count can slightly exceed the threshold: on SQL Server 2019, the store fluctuated between 160,025 and 160,041 entries. The stubs created by optimize for ad hoc workloads count as entries, so an ad hoc workload can reach the limit with a few hundred megabytes. Trace flag 174, enabled at startup, raises the limit to 640,004 entries (160,001 buckets), starting with 2012 SP1 CU14, 2012 SP2 CU5, 2014 RTM CU6, and 2014 SP1 CU1. The KB introduced it to address contention on the SOS_CACHESTORE spinlock, which occurs when many sessions insert plans into a full store, or into the same bucket at the same time.
The ratio of the number of entries to the number of buckets is called the load factor, denoted α. NIST defines it as α = number of entries / number of buckets.
SQL Server’s threshold corresponds to a load factor of 4: 160,036 entries for 40,009 buckets, or four entries per bucket on average. This ratio applies to the entire store: some buckets can contain more entries, while others contain fewer.
For a table with chaining and a good distribution of keys, the average lookup cost is on the order of O(1 + α). Bounding the load factor keeps lookups short as the total number of entries increases. Robert Sedgewick and Kevin Wayne suggest M ≈ N / 4 as a common sizing choice, with M buckets for N entries, in their Algorithms lecture slides, section 3.4, slide 20. This choice also corresponds to four entries per bucket on average.
Other implementations use a different threshold. In Tcl’s tclHash.c source code, REBUILD_MULTIPLIER = 3 triggers table growth at about three entries per bucket. Theory explains why limiting the load factor is useful; the exact threshold reflects a trade-off between:
- the time needed to walk the entries in a bucket;
- the memory used by the structures of a table with more buckets;
- the cost of synchronizing threads during concurrent access.
In SQL Server, KB3026083 documents contention on SOS_CACHESTORE and the increase in bucket count with trace flag 174. The ratio of four entries per bucket is preserved.
I found no Microsoft source explaining the specific choice of 4. A trade-off tuned through measurements seems plausible, but an empirical origin remains a hypothesis. Sedgewick and Wayne’s recommendation shows that this value appears elsewhere; it does not establish the origin of Microsoft’s choice.
The second limit is a size. The plan cache pressure limit depends on visible target memory:
| Version | Pressure limit |
|---|---|
| SQL Server 2000 | 4 GB |
| 2005 RTM and SP1 | 75% from 0 to 8 GB, plus 50% from 8 to 64 GB, plus 25% above that |
| 2005 SP2 and later | 75% from 0 to 4 GB, plus 10% from 4 to 64 GB, plus 5% above that |
| with trace flag 8032 | return to the 2005 RTM formula |
A store enters local pressure at 62.5% of this limit, according to Delaney and Korotkevitch, the only source of this figure. For target memory of 5,185 MB, the limit of a store is therefore (3,072 + 109) × 62.5% = 1,988 MB, and I measured a plateau at 1,972 MB on 2019. For target memory of 128 GB, the limit of a store is about 7.6 GB: above 4 GB, each additional GB of target memory increases the limit of a store by only 64 MB, and by 32 MB above 64 GB.
Microsoft has not republished the formula since the 2012 white paper, and I have verified it only once, at 5 GB, on 2019. On 2025, the Linux container does not let me observe it: external pressure always arrives first (see “Eviction”), and target memory there is capped by the SQL Server Platform Abstraction Layer on Linux (SQLPAL), at 1,735 MB for max server memory of 2,048 MB.
On Windows, the limit is visible. On a 2025 CU9 instance in a 4 GB virtual machine, where target memory equals max server memory, I filled SQL Plans with distinct ad hoc batches until a clock hand moved. At 1,280 and 1,536 MB, the internal hand moved, without any Resource Monitor notification, and SQL Plans reached the following plateaus:
| Target memory | Formula: 75% × 62.5% | Measured SQL Plans plateau | Plateau / formula |
|---|---|---|---|
| 1,280 MB | 614,400 KB | 583,648 KB | 95.0% |
| 1,536 MB | 737,280 KB | 700,300 to 700,500 KB (three passes) | 95.0% |
The form of the formula holds, proportional to target memory to within one part in a thousand, but the plateau is at 95% of its predicted value, or 44.5% of target memory.
There are two possible interpretations: a low watermark, where the hand starts removing entries slightly before the limit to avoid reaching it, or a threshold of 19/32 instead of 20/32 (62.5%). At the plateau, the hand removes one plan per inserted plan, and a full sweep removes about 10,400 entries, the entire store. At 1,024 MB, however, external pressure arrived first, at about 430 MB of SQL Plans, as on Linux. Trace flag 8032 can only be enabled at startup (DBCC TRACEON (8032, -1) is rejected at runtime), and below 4 GB of target memory both formulas give 75%: with -T8032, the plateau did not move, which tells us nothing about its effect above 4 GB.
The change in 2005 SP2 has a history: on 64-bit systems running 2005 RTM or SP1, single-use plans could occupy half the server’s memory, according to Jonathan Kehayias and Ted Krueger (Troubleshooting SQL Server: A Guide for the Accidental DBA, Redgate, 2011, chapter 4, “Significantly larger procedure cache” section, p. 142). The documentation for trace flag 8032 warns that reverting to the old formula can harm other memory consumers.
Cache memory
The views and the performance counter do not measure the same thing. After 2,000 distinct ad hoc batches and three procedures, on 2025 CU10:
| Source | SQL Plans | Object Plans | Bound Trees |
|---|---|---|---|
sys.dm_exec_cached_plans, sum of size_in_bytes | 121,240 KB | 376 KB | 4,928 KB |
sys.dm_os_memory_clerks, pages_kb | 128,712 KB | 384 KB | 5,104 KB |
sys.dm_os_memory_cache_counters, pages_kb | 128,784 KB | 384 KB | 5,104 KB |
sys.dm_os_memory_cache_entries, sum of pages_kb | 48,536 KB | 200 KB | 4,928 KB |
Cache Pages counter, in 8 KB pages | 82,776 KB | 8 KB | 360 KB |
The memory clerk and sys.dm_os_memory_cache_counters agree, and exceed the sum of size_in_bytes by about 6%. The difference can be accounted for exactly. In a second measurement, after 2,000 ad hoc batches, the SQL Plans clerk showed 137,696 KB, and the sum of three terms gave 137,672 KB: 130,192 KB of size_in_bytes, 4,976 KB of MEMOBJ_CACHESTORESQLCP objects (the store’s own memory, which contains the stubs and entry structures), and 2,504 KB of MEMOBJ_SQLMGR objects, the SQL Manager cache that keeps the texts.
In these measurements, the sum of pages_kb from sys.dm_os_memory_cache_entries represented only 36 to 40% of the memory accounted for by the clerk. This field describes the entry’s size when it is inserted into the cache. In my tests, it kept that value even when memory usage increased afterward.
A query prepared with sp_prepare shows the difference:
| Measurement time | pages_kb (KB) | size_in_bytes (bytes) |
|---|---|---|
| After preparation, before any execution | 48 | 57,344 |
| After the first execution | 48 | 139,264 |
The first execution built the execution context: the additional memory appears in size_in_bytes, while pages_kb stays at 48. In the store measurement, execution contexts represented about half of the total memory. This explains much of the difference.
To choose the appropriate measurement:
sys.dm_os_memory_cache_entries.pages_kbgives the size recorded at insertion, used by SQLOS to manage the entry;sys.dm_exec_cached_plans.size_in_bytesgives the memory used by the plan and the execution contexts kept with it, including their growth after insertion;- the clerk or
sys.dm_os_memory_cache_countersgives the memory used by the entire store, including its management structures.
Performance counters can also lag behind. In these tests, Cache Pages and Cache Object Counts lagged a few seconds behind the views. To track a store’s size and entry count, I therefore use sys.dm_os_memory_cache_counters:
SELECT name, type, entries_count, entries_in_use_count, pages_kb / 1024 AS mb
FROM sys.dm_os_memory_cache_counters
WHERE type IN (N'CACHESTORE_SQLCP', N'CACHESTORE_OBJCP',
               N'CACHESTORE_PHDR', N'CACHESTORE_XPROC');
The plan cache is outside the buffer pool, but within the memory limited by max server memory, as the memory architecture guide states, whereas the page for this option refers only to the buffer pool: at 1,024 MB, 60,000 ad hoc queries grow the plan cache to about 400 MB and shrink the buffer pool by the same amount. The cache can also outweigh the data: on a 4 GB instance, I saw SQL Plans at 150 MB and Bound Trees at 153 MB, together almost twice the data cache (158 MB). I proposed correcting the scope of max server memory in PR #10471. Bound Trees is often overlooked in these totals; it contains the trees for views and constraints, and uses memory just as plans do.
Invalidation and recompilation
A cached plan can become incorrect when an object it depends on changes, or less effective when the data has changed. Before using it, the engine checks whether it is still valid. If the engine considers it invalid, it recompiles the affected statement, and only that statement, starting with SQL Server 2005: the new plan replaces the old one in the same entry. The plan_handle does not change, plan_generation_num increases by 1, usecounts continues, execution_count starts again at 1 in sys.dm_exec_query_stats, and creation_time in sys.dm_exec_query_stats takes the recompilation time. Recompilation therefore removes nothing from the cache.
SELECT qs.plan_handle, qs.plan_generation_num, qs.creation_time,
       qs.execution_count, LEFT(t.text, 80) AS text_start
FROM sys.dm_exec_query_stats AS qs
CROSS APPLY sys.dm_exec_sql_text(qs.sql_handle) AS t
ORDER BY qs.plan_generation_num DESC;
A plan_handle that changes between measurements means the plan left the cache; a plan_generation_num that increases for the same plan_handle means it was recompiled in place. creation_time does not distinguish the two, since it gives the compilation time, not the time the entry entered the cache.
The sql_statement_recompile Extended Event gives the cause in the recompile_cause field. The statement_recompile_cause map has 34 values on 2025 CU10, compared with 23 on 2022 CU26 and 14 in the 2012 white paper; the page for the old SQL:StmtRecompile event class lists only 11. I triggered the most common ones:
| Action | Observed cause |
|---|---|
SET CONCAT_NULL_YIELDS_NULL OFF in a procedure body | Set option change, on the first execution only |
CREATE TABLE #t followed by INSERT and SELECT in a procedure | Deferred compile, for the INSERT and SELECT, on the first execution |
ALTER TABLE ... ADD on a table in use | Schema changed |
6,000 rows modified out of 10,000, then a join with GROUP BY | Statistics changed |
the same modifications, then a COUNT(*) with a trivial plan | no recompilation |
UPDATE STATISTICS ... WITH FULLSCAN without prior modifications | no recompilation |
| temporary table growing from 10 to 10,000 rows between two executions | Statistics changed |
These tests give several results:
- The trivial plan did not recompile after a major change in statistics.
- Updating a statistic without first modifying the data did not trigger recompilation.
- The
SETstatement in the procedure triggered a single recompilation, on the first execution. - The increase in the temporary table’s row count triggered recompilation with the cause
Statistics changed.
The cause Temp table changed appears in another case: a procedure reads a temporary table created outside it, then that table’s definition changes between two executions of the procedure. The following example shows this behavior:
CREATE OR ALTER PROCEDURE dbo.q_ext AS SELECT COUNT(*) AS n FROM #t WHERE a > 0;
GO
CREATE TABLE #t (a int);
EXEC dbo.q_ext;                       -- compilation, caching
EXEC dbo.q_ext;                       -- reuse
GO
ALTER TABLE #t ADD b int NULL;
GO
EXEC dbo.q_ext;                       -- Temp table changed
GO
DROP TABLE #t;
GO
CREATE TABLE #t (a bigint);
EXEC dbo.q_ext;                       -- Temp table changed
GO
CREATE INDEX ix ON #t (a);
GO
EXEC dbo.q_ext;                       -- Schema changed
The table can have been created by the calling batch, by a calling procedure, or by a previous batch in the session; an ad hoc batch that rereads #u after ALTER TABLE #u ADD gives the same cause. Adding an index gives Schema changed. In a procedure that creates #t itself, ALTER TABLE gives Schema changed on the first execution, then nothing further. The thresholds and cases are detailed in La recompilation des plans and Les statistiques et les plans en cache (in French).
sp_recompile on a table removes nothing from the cache: the plans that read it remain, and each recompiles on its next execution. On a procedure, it removes the plan (sp_cache_remove gives the reason Sp module recompile).
Clearing the cache
Clearing the cache means removing entries without any limit requiring it. The commands:
| Command | Effect | Since |
|---|---|---|
DBCC FREEPROCCACHE | the entire instance’s plan cache | at least 2000 |
DBCC FREEPROCCACHE (plan_handle) | one plan; with a sql_handle, a batch’s plans; with a pool name, a Resource Governor pool’s plans | 2008 |
DBCC FREESYSTEMCACHE ('SQL Plans') | a store’s unused entries; 'ALL' for all caches | 2005 |
ALTER DATABASE SCOPED CONFIGURATION CLEAR PROCEDURE_CACHE | the current database’s plans | 2016 |
ALTER DATABASE SCOPED CONFIGURATION CLEAR PROCEDURE_CACHE plan_handle | one plan in the current database | 2019 |
To remove the plan for a single query, the safest form is the first command with a plan_handle, found through its text:
SELECT p.plan_handle, p.usecounts, LEFT(t.text, 80) AS text_start
FROM sys.dm_exec_cached_plans AS p
CROSS APPLY sys.dm_exec_sql_text(p.plan_handle) AS t
WHERE t.text LIKE N'%CreationDate%FROM%Enrollment%'
  AND t.text NOT LIKE N'%dm_exec_cached_plans%';

-- replace the value with a plan_handle returned by the previous query
DBCC FREEPROCCACHE (0x060005006583130FA0E2279A0D00000001000000000000000000000000000000000000000000000000000000);
For a query parameterized by the engine, remove the Prepared entry: removing the Adhoc shell query leaves the plan in cache.
DBCC FREESYSTEMCACHE ('SQL Plans') leaves procedures in place; ('Object Plans') leaves ad hoc plans. Both remove only entries unused at the time of the command. Delaney and Low also mention the undocumented DBCC FLUSHPROCINDB, which CLEAR PROCEDURE_CACHE replaces.
Reconfiguration and database options
Some operations clear the cache without an explicit request. I placed an ad hoc entry and a procedure in three databases, the test database, a second database, and master, then performed each action while monitoring sp_cache_remove:
| Action | Test database | Other database | master | sp_cache_remove method and reason |
|---|---|---|---|---|
max degree of parallelism from 0 to 2, or from 2 to 0 | cleared | cleared | cleared | Proc Cache Flush, Server reconfiguration |
cost threshold for parallelism from 5 to 10 | cleared | cleared | cleared | same |
max server memory from 2,048 to 2,000 MB | cleared | cleared | cleared | same |
max server memory from 2,000 to 2,048 MB | kept | kept | kept | none |
RECONFIGURE without a value change | kept | kept | kept | none |
optimize for ad hoc workloads from 0 to 1 | kept | kept | kept | none |
CLEAR PROCEDURE_CACHE in the test database | cleared | kept | kept | Compplan Remove, Database settings update |
DBCC FREEPROCCACHE (plan_handle) | only the entry | kept | kept | Compplan Remove, Dbcc command flush |
ALTER DATABASE ... SET AUTO_UPDATE_STATISTICS_ASYNC ON | cleared | kept | kept | Compplan Remove, Database state update |
ALTER DATABASE ... SET COMPATIBILITY_LEVEL = 160 | cleared | kept | kept | Compplan Remove, Database compatibility update |
DBCC CHECKDB | kept | kept | kept | none |
sp_recompile on a table | kept | kept | kept | none |
The DBCC FREEPROCCACHE page lists sixteen configuration options that clear the cache, including max degree of parallelism, cost threshold for parallelism, max server memory, min server memory, max worker threads, user options, and query governor cost limit. For max server memory, the measurement adds a qualification: the cache is cleared only when the value decreases. On Windows, a 48 MB decrease cleared all three stores, whereas a 48 MB increase followed by a 576 MB increase (from 1,024 to 1,600 MB) removed nothing, and returning from 1,600 to 1,024 MB cleared everything again. The measurement was performed twice. On Linux, I had obtained the same result with 48 MB in each direction. Changing MAXDOP in production therefore clears the plans of all databases, and the instance subsequently recompiles its entire workload; the database-level setting, ALTER DATABASE SCOPED CONFIGURATION SET MAXDOP, clears only that database.
Clearing a database also removes the variants of its parameter-sensitive procedures, stored in SQL Plans (see below). DBCC CHECKDB has not cleared the cache since 2005 SP2.
The documentation contradicts itself about the scope of database options. The ALTER DATABASE page says that COLLATE, MODIFY_NAME, OFFLINE, ONLINE, PAGE_VERIFY, READ_ONLY, READ_WRITE, and a few filegroup options clear the instance’s cache, and adds AUTO_CLOSE, dropping a snapshot, and rebuilding the log; the SET options page adds restoring and detaching; the DROP DATABASE page limits dropping a snapshot to its own plans, the RESTORE page limits restoring to the restored database, and Greg Low’s SQL Server 2012 white paper lists SET ONLINE, SET OFFLINE, and MODIFY NAME among database-scoped cache clearing operations. I measured them one by one, in the same way as in the previous table:
| Action | Affected database | Other database | master | sp_cache_remove reason |
|---|---|---|---|---|
SET OFFLINE WITH ROLLBACK IMMEDIATE | cleared | kept | kept | Database shutdown |
SET ONLINE | nothing to clear | kept | kept | none |
MODIFY NAME | cleared | kept | kept | Database name change |
SET READ_ONLY, then SET READ_WRITE | cleared each time | kept | kept | Database shutdown |
SET PAGE_VERIFY TORN_PAGE_DETECTION | cleared | kept | kept | Database state update |
COLLATE French_CI_AS on an empty database | cleared | kept | kept | Database collation update |
RESTORE DATABASE ... WITH REPLACE | cleared | kept | kept | Database shutdown |
DROP DATABASE on a snapshot | cleared (the snapshot) | kept, including the source database | kept | Drop database |
DROP DATABASE on a database in use | cleared | kept | kept | Drop database |
MODIFY FILEGROUP DEFAULT, READ_ONLY, READ_WRITE | cleared each time | kept | kept | not recorded in this pass |
| detaching then attaching | cleared | kept | kept | not recorded in this pass |
DBCC FREESYSTEMCACHE ('ALL') | cleared | cleared | cleared | System Flush, one event per store |
Checking the plan_handle values confirms this scope on SQL Server 2019 CU32-GDR (15.0.4500.2), 2022 CU27-GDR (16.0.4305.5), and 2025 CU10 (17.0.5035.5), in fresh Linux containers. All three plan types, Adhoc, Prepared, and Proc, were tracked in the modified database, another database, and master. The tests also cover filegroup options and detaching. Dropping a snapshot preserves the plans of its source database.
The initial pass on 2025 CU10 also tracked events, which clarifies the removal mechanism:
- Plans in the affected database are removed one by one, with the
Compplan Removemethod and one event per entry. SET ONLINEremoves nothing in this test: the preceding transition toOFFLINEhad already removed the plans.READ_ONLYandREAD_WRITEclose the database. They therefore give the same removal reason,Database shutdown, asOFFLINEandRESTORE.
These results differ from the instance-wide scope stated on the ALTER DATABASE page. They agree with the RESTORE and DROP DATABASE pages, and with Greg Low’s white paper cited above.
I had already measured in La fermeture automatique d’une base (in French) that AUTO_CLOSE removes only the plans of the closed database, on 2019, 2022, and 2025.
The scope of rebuilding the log remains to be measured.
The log message
A store flush writes a message like this to the error log:
SQL Server has encountered 5 occurrence(s) of cachestore flush for the 'Object Plans' cachestore (part of plan cache) due to some database maintenance or reconfigure operations.
The log accumulates flushes before publishing their count. In my tests, writing the messages waited for another flush after an interval of at least five minutes:
- at
13:20:43, a first block of messages counted the flushes since13:15; - at
13:27:03, aDBCC FREEPROCCACHEtriggered the next block to be written.
The end of the message indicates the origin of the flushes:
due to 'DBCC FREEPROCCACHE' or 'DBCC FREESYSTEMCACHE' operationsfor those commands;due to some database maintenance or reconfigure operationsfor maintenance or reconfiguration operations.
In these tests, CLEAR PROCEDURE_CACHE, database options, and DBCC FREEPROCCACHE (plan_handle) removed entries without flushing a store. These operations produced no messages of this type.
The message therefore summarizes flushes since the previous message was written. It gives neither the time of each action nor the affected database. To track individual removals, I use Extended Events:
sp_cache_removetracks flushes and explicit removals;query_cache_removal_statisticsobserves removals during clock eviction, with the qualification about uncached plans explained earlier.
Plans with variants
SQL Server 2022 added Parameter Sensitive Plan optimization (PSP), at compatibility level 160. At compilation, the engine identifies up to three parameterized equality predicates in a statistics histogram whose cardinality varies greatly with the value. Instead of one plan, it compiles a dispatcher plan, which contains a low and a high boundary for each predicate, dividing cardinalities into three ranges. At execution, the dispatcher determines the range of the value and calls a query variant, compiled on its first use and cached as a prepared statement.
PSP is available in the Enterprise, Standard, and Express editions of SQL Server 2022 and SQL Server 2025, as well as the Web edition of 2022, according to the feature tables by edition. The database must be at compatibility level 160 or higher.
I measured the cache distribution on 2025, at level 170, with a procedure whose parameter identifies a customer with 100,000 rows or a customer with one row:
| Entry | Type | store | Contents |
|---|---|---|---|
| procedure dispatcher | Proc | Object Plans | <Dispatcher> element with ParameterSensitivePredicate LowBoundary="100" HighBoundary="100000" and the statistic used |
| variant 1 | Prepared | SQL Plans | text ending with option (PLAN PER VALUE(ObjectID = 1669580986, QueryVariantID = 1, predicate_range(... = @c, 100.0, 100000.0))) |
| variant 3 | Prepared | SQL Plans | same text, QueryVariantID = 3 |
To identify a variant and find its original procedure:
- The variant’s
objectidattribute insys.dm_exec_plan_attributesis a hash.sys.dm_exec_sql_textreturns aNULLobjectid. To find the procedure, read theObjectIDin thePLAN PER VALUEtext. - The variant number appears in that same text. It also appears in the
QueryVariantIDattribute of theQueryPlanelement in the XML plan. - Comments in the procedure body are not copied into the variants’ text. To find them in the cache, use a filter on
PLAN PER VALUE, as in the query below.
SELECT p.objtype, p.usecounts, p.size_in_bytes, t.text
FROM sys.dm_exec_cached_plans AS p
CROSS APPLY sys.dm_exec_sql_text(p.plan_handle) AS t
WHERE t.text LIKE N'%PLAN PER VALUE%'
  AND t.text NOT LIKE N'%dm_exec_cached_plans%';
Execution statistics are in the variants: sys.dm_exec_query_stats had no row for the procedure’s plan and two rows for the variants, with the same query_hash and different query_plan_hash values, while sys.dm_exec_procedure_stats counted all three executions. The same mechanism applies to sp_executesql, whose dispatcher is then a Prepared plan in SQL Plans. One documentation page had reversed the stores of the dispatcher and variants; Microsoft corrected it in 2026.
Level 160 is sufficient for PSP. On 2025, the same procedure produced exactly the same entries at level 160 as at level 170: one dispatcher, variants 1 (rare value, one estimated row) and 3 (frequent value, 100,000 rows), and the same boundaries of 100 and 100,000.
SQL Server 2025 extends PSP to multiple predicates on the same table and adds, at level 170, optional parameter plan optimization (OPPO), which uses the same dispatchers and variants for col = @p OR @p IS NULL predicates. The requirements for enabling OPPO are compatibility level 170 and OPTIONAL_PARAMETER_OPTIMIZATION = ON, which is enabled by default.
The difference is visible with a procedure of this type:
CREATE OR ALTER PROCEDURE dbo.p_oppo @c int = NULL
AS SELECT SUM(amount) AS s FROM dbo.Orders WHERE customer_id = @c OR @c IS NULL;
GO
EXEC dbo.p_oppo 2; EXEC dbo.p_oppo NULL; EXEC dbo.p_oppo 3; EXEC dbo.p_oppo NULL;
At level 160, the procedure received only one PSP variant, intended for one row, which served all four calls, including the two calls with NULL that read the table’s 200,000 rows with a plan intended for one. At level 170, it received two variants, whose text combines both mechanisms:
option (PLAN PER VALUE(ObjectID = 178099675, QueryVariantID = 1, optional_predicate(@c IS NULL),
        predicate_range([cachelab].[dbo].[Orders].[customer_id] = @c, 100.0, 100000.0)))
option (PLAN PER VALUE(ObjectID = 178099675, QueryVariantID = 4, optional_predicate(@c IS NULL),
        predicate_range([cachelab].[dbo].[Orders].[customer_id] = @c, 100.0, 100000.0)))
Variant 4 estimates 200,000 rows for @c IS NULL; variant 1 estimates one for a rare value. The numbers 1, 3, and 4 are not a counter: they identify the slot selected by the dispatcher (rare value, frequent value, missing parameter). Variants count toward the SQL Plans entry limit, as the PSP page notes.
In the publications I consulted, I found no scientific description of the design of PSP as shipped in SQL Server.
Its principle resembles the parametric optimization described in 1992 by Yannis E. Ioannidis, Raymond T. Ng, Kyuseok Shim, and Timos K. Sellis in Parametric Query Optimization, VLDB, pp. 103-114: prepare several plans suited to different regions of the parameter space, then select the one suited to the values encountered at execution, limiting optimization work at that point.
In 2010, Microsoft filed the patent Parameter-sensitive plans, US 8,874,547 B2, published in 2014, with Cesar A. Galindo-Legaria among the inventors. It describes a dispatcher, a selectivity space divided into regions, and compilation of a plan for the first value encountered in each region. PSP resembles this mechanism, with three ranges per predicate. I found no source establishing that PSP implements this patent.
Microsoft Research researchers have also published experimental work using SQL Server:
- Anshuman Dutt, Vivek Narasayya, and Surajit Chaudhuri, Leveraging Re-costing for Online Optimization of Parameterized Queries with Guarantees, SIGMOD, 2017, pp. 1539-1554. The authors evaluate their technique in a modified version of the SQL Server 2016 optimizer.
- Kapil Vaidya, Anshuman Dutt, Vivek Narasayya, and Surajit Chaudhuri, Leveraging Query Logs and Machine Learning for Parametric Query Optimization, PVLDB, vol. 15, no. 3, November 2021, pp. 401-413, presented at VLDB 2022. Their prototype on SQL Server 2017 uses query logs to choose which plans to keep and train a plan selection model.
These studies shed light on the problem PSP addresses. Their presence in the literature is not enough to establish a connection with the product’s implementation.
Query Store and the cache
Query Store keeps queries, their plans, and their execution statistics in the database, and survives restarts, unlike the cache: after a restart, the oldest cached plan is as old as the service. Query Store does not replace the cache. A plan forced by Query Store is compiled like other plans, under the constraint of the forced plan, then cached; compilation is not avoided. Recompilation causes specific to Query Store (missing plan, forcing failure, change in forcing policy) appear in the causes map.
Several recent mechanisms store their state in the cached plan and lose it when the plan leaves the cache. Memory grant feedback, in batch mode since 2017 and row mode since 2019, corrected a plan’s memory grant only in the cache until SQL Server 2022 persisted it in Query Store, when Query Store is enabled in read-write mode; otherwise, plan eviction still loses it. sys.dm_exec_query_plan_stats (2019), which provides the last known actual plan, returns nothing for an evicted plan.
From SQL Server 2022 CU8 through CU11 (fixed in CU12), cardinality estimation feedback caused a cache leak: plans marked as in use could no longer be removed, either by the clock or by DBCC FREEPROCCACHE, and their count rose to 50,000 or more.
Instruments
| Instrument | What it shows |
|---|---|
sys.dm_exec_cached_plans | one row per entry: type, size, usecounts, plan_handle |
sys.dm_exec_plan_attributes | the cache key and a plan’s context counters |
sys.dm_exec_query_stats, sys.dm_exec_procedure_stats, sys.dm_exec_trigger_stats, sys.dm_exec_function_stats | execution statistics, per statement or module, while the plan is cached |
sys.dm_exec_cached_plan_dependent_objects | a plan’s execution contexts and cursors |
sys.dm_os_memory_cache_counters | size and entry count per store |
sys.dm_os_memory_cache_hash_tables | buckets, chain lengths, lookup hits and misses |
sys.dm_os_memory_cache_clock_hands | both hands and their removals |
sys.dm_os_memory_cache_entries | each entry’s cost, size, and state |
sp_cache_insert, sp_cache_hit, sp_cache_miss events | insertion, reuse, failed lookup, but only for an uncached batch or a session that was waiting for a compile lock |
sp_cache_remove event | explicit removal (DBCC command, database option, store flush), with its method and reason (38 reasons on 2025); does not see clock evictions |
plan_not_cached event | what was not cached, and why (70 reasons) |
query_cache_removal_statistics event | a query’s statistics when its plan is destroyed, including by the clock: the only event that sees evictions |
sql_statement_recompile event | statement recompilation and its cause |
SQLServer:Plan Cache counters | hit rate, object count, pages, per store, with a lag of a few seconds |
SQLServer:SQL Statistics counters | compilations, recompilations, parameterization attempts |
No Learn page describes the sp_cache_* or plan_not_cached events, and query_cache_removal_statistics is only mentioned by name; their fields can be read in sys.dm_xe_object_columns, and their map values in sys.dm_xe_map_values. A session that tracks removals from a cache, on a test instance:
CREATE EVENT SESSION track_removals ON SERVER
ADD EVENT sqlserver.sp_cache_remove (
    ACTION (sqlserver.database_id, sqlserver.sql_text))
ADD TARGET package0.ring_buffer;
GO
ALTER EVENT SESSION track_removals ON SERVER STATE = START;
The SQL Compilations/sec counter counts more than optimizations. It also increases for a shell query lookup and parameterization: under forced parameterization, a simulated website produced 4,640 to 5,256 compilations per second without any optimization, as sys.dm_exec_query_optimizer_info showed. The ratio of compilations to batches per second is therefore not enough to determine that a workload is poorly parameterized.
The cache in other engines
Other engines have made different choices, and the comparison helps explain SQL Server’s choices.
Oracle shares cursors in the shared pool: one parent cursor per exact text, child cursors per plan and environment, the equivalent of SQL Server’s SET options. The optimizer reads bind variable values on the first parse (bind peeking), SQL Server’s sniffing. Since 11g, adaptive cursor sharing learns afterward, from execution statistics, that a cursor is sensitive to its values, and stores selectivity ranges per predicate: this is PSP, except that PSP decides at compilation, based on the histogram. Oracle also invalidates cursors gradually after statistics are updated, each after a random delay, which SQL Server does not do.
PostgreSQL has no cache shared between sessions: a prepared statement lives in its session. With plan_cache_mode = auto, the first five executions use custom plans for the received values, then the engine compares their average cost with that of a generic plan and keeps the generic plan if it is no more expensive. The code adds an estimate of planning work to the cost of a custom plan, 1000 × cpu_operator_cost × (relations + 1), which its comment considers “probably on the low side.” PostgreSQL thus accounts for planning cost in its choice. SQL Server does not choose between a custom plan and a generic plan this way.
Db2 has kept the System R model for static SQL: packages compiled ahead of time by BIND, invalidated by their dependencies. MySQL has no shared plan cache, and removed its result cache, which was not a plan cache, in 8.0.
Open questions
What neither the documentation, nor my measurements, nor the debugger has settled:
- how
CacheClockAlgorithm::CalculateCost, which combines compilation ticks and pages, produces the sequence 0, 1, 2, 4, 8, 16 measured on each reuse; - whether reuse under pressure restores an entry to its original cost when that original cost is below 16 (entries at 16 return to 16);
- the function that calculates the hashed
objectidof an ad hoc batch, and exactly what the address in bytes 8 to 15 of theplan_handleidentifies; - whether the “square” in Zobrist hashing is a node’s position or its full path in the tree;
- eviction of a frequently used plan when the store is full of prepared plans, which requires target memory of about 120 GB for 48 KB plans;
- the scope of rebuilding the log;
- the rule that separates
SensInfoandZeroCostPlanfor definition statements alone in their batch; - the reason why an exception destroys the execution context, which I infer without having read it in the code.
Bibliography
The following references collect the sources cited in the article, with the editions used and the relevant chapters.
Books
- Mara Bos, Rust Atomics and Locks, O’Reilly, 2023. Chapter 7, “Understanding the Processor”, x86 compare-and-exchange instruction.
- Andrew S. Tanenbaum and Herbert Bos, Modern Operating Systems, Pearson, 5th edition, 2023 (published in October 2022). Chapter 3, “Memory Management,” page replacement algorithms and aging.
- Jonathan Kehayias and Ted Krueger, Troubleshooting SQL Server: A Guide for the Accidental DBA, Redgate, 2011. Discussion of memory and plan cache size in SQL Server 2005 and 2008.
- Kalen Delaney et al., Microsoft SQL Server 2012 Internals, Microsoft Press, 2013. Chapter 12, “Plan caching and recompilation,” written by Kalen Delaney, particularly the “Cache stores” section and table 12-1.
- Kalen Delaney et al., Inside Microsoft SQL Server 2005: Query Tuning and Optimization, Microsoft Press, 2007. Chapter 5, “Plan Caching and Recompilation,” also available in the Microsoft archives.
- Dmitri Korotkevitch, Pro SQL Server Internals, Apress, 1st edition, 2014. Chapter 26, “Plan Caching.”
- Grant Fritchey, SQL Server Execution Plans, Redgate, 3rd edition, 2018. “Plan aging” section, p. 35, “Criteria for plan reuse” section, p. 36, and chapter 9, “Exploring Plan Reuse.”
- Grant Fritchey, SQL Server 2025 Query Performance Tuning: Troubleshoot and Optimize Query Performance, Apress, 7th edition, 2026. Chapter 2, “Execution Plan Generation and the Query Optimizer”, “Aging of the Execution Plan” section, pp. 37-38; chapters 7, “Execution Plan Cache Behavior,” and 8, “Query Recompilation.”
- Steven Wort et al., Professional SQL Server 2005 Performance Tuning, Wrox/Wiley, 2008, ISBN 9780470176399. Publisher’s excerpt.
Microsoft white papers
- Arun Marathe, revised by Shu Scott, Batch Compilation, Recompilation, and Plan Caching Issues in SQL Server 2005, Microsoft, December 2006 update.
- Greg Low, Plan Caching in SQL Server 2008, Microsoft, August 2009.
- Greg Low, Plan Caching and Recompilation in SQL Server 2012, Microsoft, March 2013. See in particular execution contexts, parallel sections, cache keys, and appendix A on simple parameterization.
Research papers and reports
- Anshuman Dutt, Vivek Narasayya, and Surajit Chaudhuri, Leveraging Re-costing for Online Optimization of Parameterized Queries with Guarantees, ACM SIGMOD, 2017, pp. 1539-1554, DOI 10.1145/3035918.3064040.
- Kapil Vaidya, Anshuman Dutt, Vivek Narasayya, and Surajit Chaudhuri, Leveraging Query Logs and Machine Learning for Parametric Query Optimization, PVLDB, vol. 15, no. 3, November 2021, pp. 401-413, DOI 10.14778/3494124.3494126.
- Redha Gouicem, Operating Systems and System Software, RWTH Aachen. “Page Replacement: LRU Approximation With Aging” section.
- Edsger W. Dijkstra, Recursive programming, Numerische Mathematik, vol. 2, 1960, pp. 312-318.
- Donald D. Chamberlin et al., A History and Evaluation of System R, Communications of the ACM, vol. 24, no. 10, October 1981, pp. 632-646.
- Fernando J. Corbató, A Paging Experiment with the Multics System, in In Honor of Philip M. Morse, MIT Press, 1969, pp. 217-228.
- Victor F. Nicola, Asit Dan, and Daniel M. Dias, Analysis of the Generalized Clock Buffer Replacement Scheme for Database Transaction Processing, ACM SIGMETRICS, 1992.
- Neal E. Young, On-Line Caching as Cache Size Varies, ACM-SIAM SODA, 1991. Journal version: The k-server dual and loose competitiveness for paging, Algorithmica, vol. 11, no. 6, 1994, pp. 525-541.
- Pei Cao and Sandy Irani, Cost-Aware WWW Proxy Caching Algorithms, USENIX USITS, 1997, pp. 193-206.
- Albert L. Zobrist, A New Hashing Method with Application for Game Playing, technical report 88, University of Wisconsin, 1970.
- J. Lawrence Carter and Mark N. Wegman, Universal Classes of Hash Functions (Extended Abstract), ACM STOC, 1977, pp. 106-112. Journal version: Universal Classes of Hash Functions, Journal of Computer and System Sciences, vol. 18, no. 2, 1979, pp. 143-154.
- Mihai Pătrașcu and Mikkel Thorup, The Power of Simple Tabulation Hashing, ACM STOC, 2011, pp. 1-10. Authors’ full version.
- Yannis E. Ioannidis, Raymond T. Ng, Kyuseok Shim, and Timos K. Sellis, Parametric Query Optimization, VLDB, 1992, pp. 103-114. Full version: Parametric query optimization, The VLDB Journal, vol. 6, no. 2, 1997, pp. 132-151, DOI 10.1007/s007780050037.
- Sumit Ganguly, Design and Analysis of Parametric Query Optimization Algorithms, VLDB, 1998, pp. 228-238.
Technical blog posts
- Slava Oks, SQLOS Caching, March 18, 2005, and Q and A: Clock Hands - what are they for?, November 20, 2005, Microsoft archives.
- Sangeetha Shekar and the SQL Programmability team, series on the plan cache, January 2007, particularly 6.0 Best Programming Practices, 7.0 Costing Cache Entries, and 9.0 Memory Pressure Limits. Archive republication dates differ from the dates of the original posts.
- SQL Server team, Name resolution, default schema, implicit schema Part I, originally published April 3, 2006. “Active Default Schema” passage.
- Bart Duncan, Query Fingerprints and Plan Fingerprints: The Best SQL 2008 Feature That You’ve Never Heard Of, September 3, 2008.
- Aaron Bertrand, Multiple Plans for an “Identical” Query, SQLPerformance, November 20, 2014.
- Paul White, Simple Parameterization and Trivial Plans, SQLPerformance, 2022: part 1, part 2, part 3, part 4, part 5, part 6.
- Paul White, Parameter Sniffing, Embedding, and the RECOMPILE Options, SQLPerformance, August 28, 2013.
- Erland Sommarskog, Slow in the Application, Fast in SSMS? Understanding Performance Mysteries, particularly the sections on cache keys, the default schema, and autoparameterization.
- Kendra Little, Query Hash Values Are Meaningless in SQL Server: They May Be Reset to Be the Same Value as the Query Plan Hash, November 24, 2024.
Microsoft documentation
- Microsoft, Editions and supported features of SQL Server 2022 and Editions and supported features of SQL Server 2025, “Intelligent query processing” tables, PSP availability by edition.
- Microsoft, SQL Server, Plan Cache object and sys.dm_exec_procedure_stats, cache counters and the caching date of procedure plans.
- Microsoft, Query Processing Architecture Guide, particularly the “Execution context,” “Cache multiple plans for the same query,” and “Remove execution plans from the plan cache” sections.
- Microsoft, Memory Management Architecture Guide.
- Microsoft, sys.dm_exec_cached_plans and sys.dm_exec_plan_attributes.
- Microsoft, sys.dm_exec_query_stats and sys.dm_exec_cached_plan_dependent_objects.
- Microsoft, sys.dm_os_memory_objects and sys.dm_os_memory_cache_entries.
- Microsoft, sys.dm_os_memory_cache_counters, sys.dm_os_memory_cache_hash_tables, and sys.dm_os_memory_cache_clock_hands.
- Microsoft, sys.query_store_query.
- Microsoft, sp_executesql, particularly the “OPTIMIZED_SP_EXECUTESQL” section.
- Microsoft, Server Configuration: optimize for ad hoc workloads.
- Microsoft, ALTER DATABASE SCOPED CONFIGURATION and DBCC FREEPROCCACHE.
- Microsoft, CREATE PROCEDURE and Execute a Stored Procedure.
- Microsoft, sqlcmd utility,
-Ioption. - Microsoft, Configure parameters with Microsoft.Data.SqlClient and SqlParameter.Size.
- Microsoft, Troubleshoot blocking issues caused by compile locks, particularly the “Stored procedure is invoked as a Language event” section.
- Microsoft, KB3026083, SOS_CACHESTORE spinlock contention on ad hoc SQL Server plan cache causes high CPU usage, entry limit and trace flag 174.
- Microsoft, Parameter Sensitive Plan optimization, dispatcher plans, variants, and known issues.
Data structures
- NIST, Load factor, Dictionary of Algorithms and Data Structures. Definition of a hash table’s load factor.
- Robert Sedgewick and Kevin Wayne, Algorithms lecture slides, section 3.4, “Hash Tables”, Princeton. Slide 20, “Analysis of separate chaining,” page 5 of the PDF: common sizing choice
M ≈ N / 4. - Tcl team,
generic/tclHash.c. TheREBUILD_MULTIPLIERconstant and hash table growth.
Other engines
- PostgreSQL Global Development Group,
buf_internals.h, PostgreSQL 18 branch. Definition of the buffer state word and atomic updates. - Oracle, Improving Real-World Performance Through Cursor Sharing, Oracle Database 19c SQL Tuning Guide.
- PostgreSQL Global Development Group, PREPARE, PostgreSQL 18 documentation, and plancache.c, particularly the
choose_custom_planfunction. - Oracle, What Is New in MySQL 8.0, section on removed features, including the result cache.
Standards and patents
- Roy T. Fielding, Mark Nottingham, and Julian Reschke, HTTP Caching, RFC 9111, June 2022. Section 2, HTTP cache key.
- Nimish S. Khanolkar, Pawel Terlecki, Cesar A. Galindo-Legaria, Yavor V. Angelov, Mostafa Elhemali, and Pooja N. Darera, Parameter-sensitive plans, US 8,874,547 B2, Microsoft. Filed January 4, 2010, published October 28, 2014.
Scripts and documentation corrections
- Rudi Bruchez, Multiple plans for the same text (in French),
TSQL-Scriptsrepository. - MicrosoftDocs/sql-docs, PR #10501, Correct plan stub identification and clarify database cache clearing, proposed correction submitted November 15, 2026.
- MicrosoftDocs/sql-docs, PR #10502, Correct the database scope of plan cache removal for ALTER DATABASE, proposed correction submitted November 15, 2026.